English learners in Pennsylvania have a chronic absence rate of 20.4%. That is exactly the statewide average, down from 1.0 percentage point above it before COVID. They are the only student group in the state whose attendance gap has closed entirely.
Every other gap widened.
The racial gaps
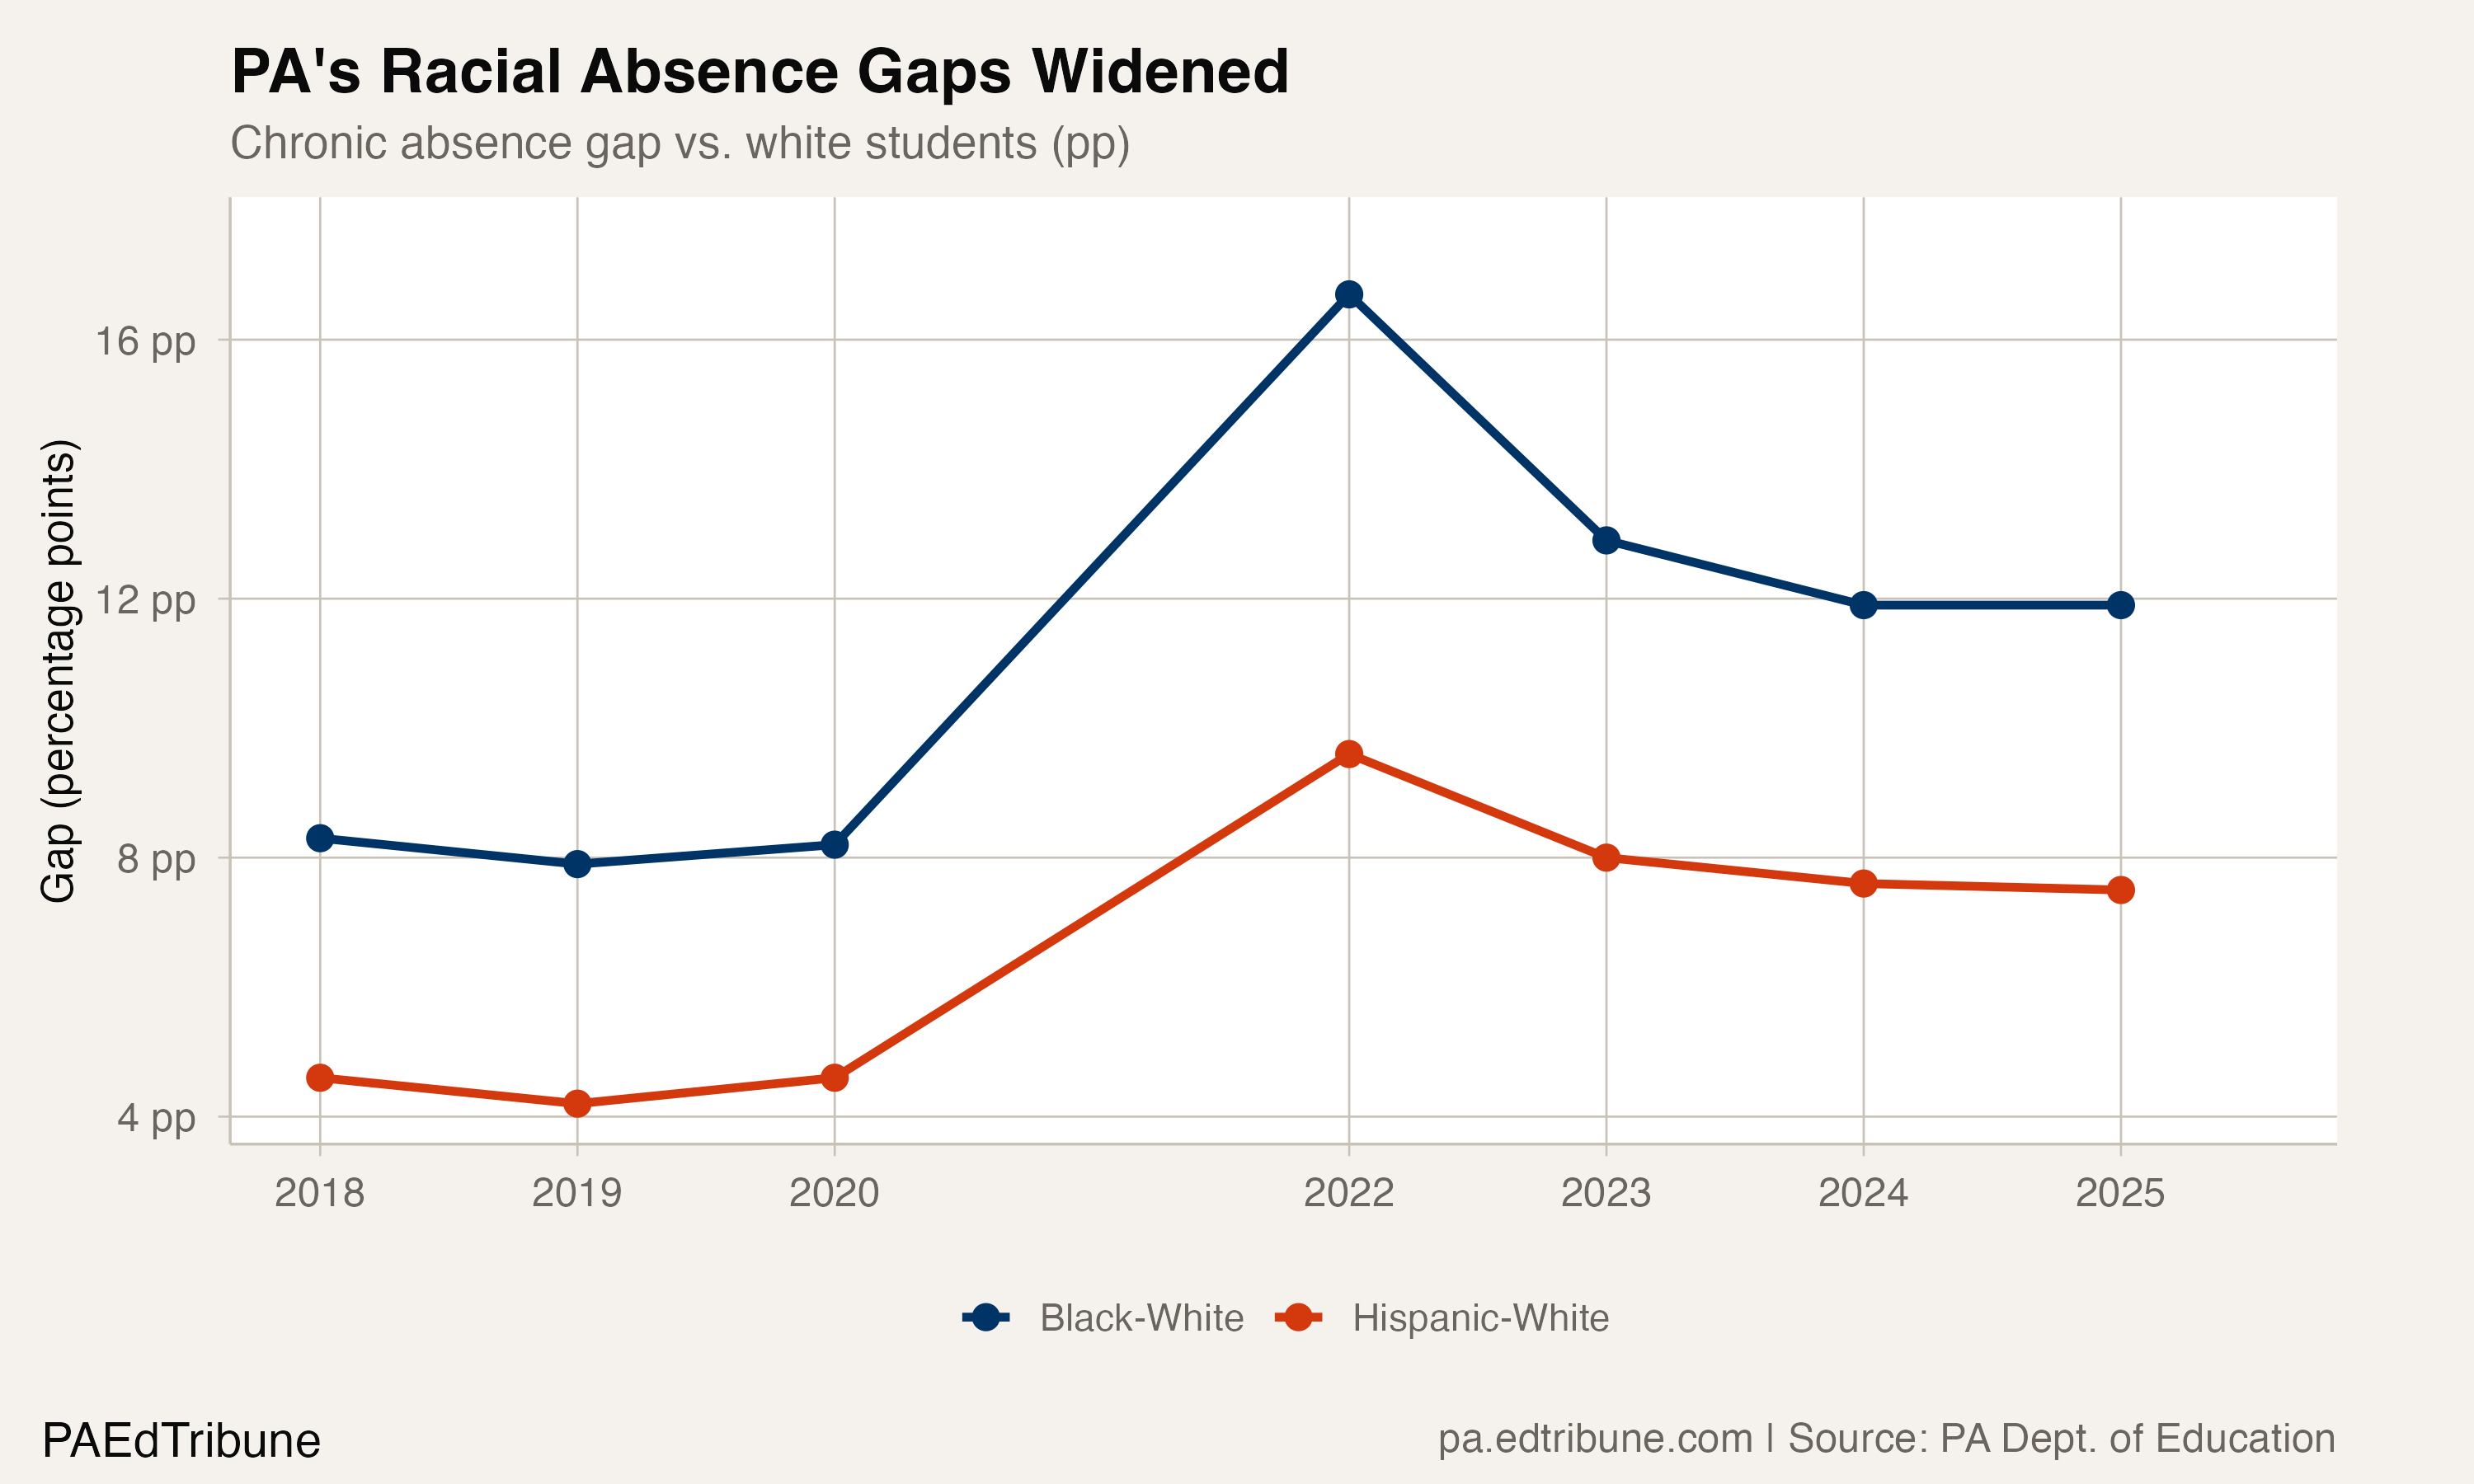
Before COVID, the Black-white chronic absence gap in Pennsylvania was 8.2 percentage points (20.4% vs. 12.2% in 2019-20). When schools reopened in 2021-22, it exploded to 16.7 points (30.3% vs. 13.6%). White chronic absence barely moved during COVID while Black chronic absence surged by nearly 10 points.
Two years of recovery narrowed the gap, but only by pulling both rates down, not by closing the distance between them. In 2024-25, the Black rate is 28.9% and the white rate is 17.0%, a gap of 11.9 percentage points, 3.7 points wider than before the pandemic.
The Hispanic-white gap followed a similar trajectory: 4.6 points pre-COVID, peaking at 9.6 in 2022, settling at 7.5 in 2025. Hispanic students have a chronic absence rate of 24.5%, 7.5 points above white students.
The asymmetry of COVID's impact
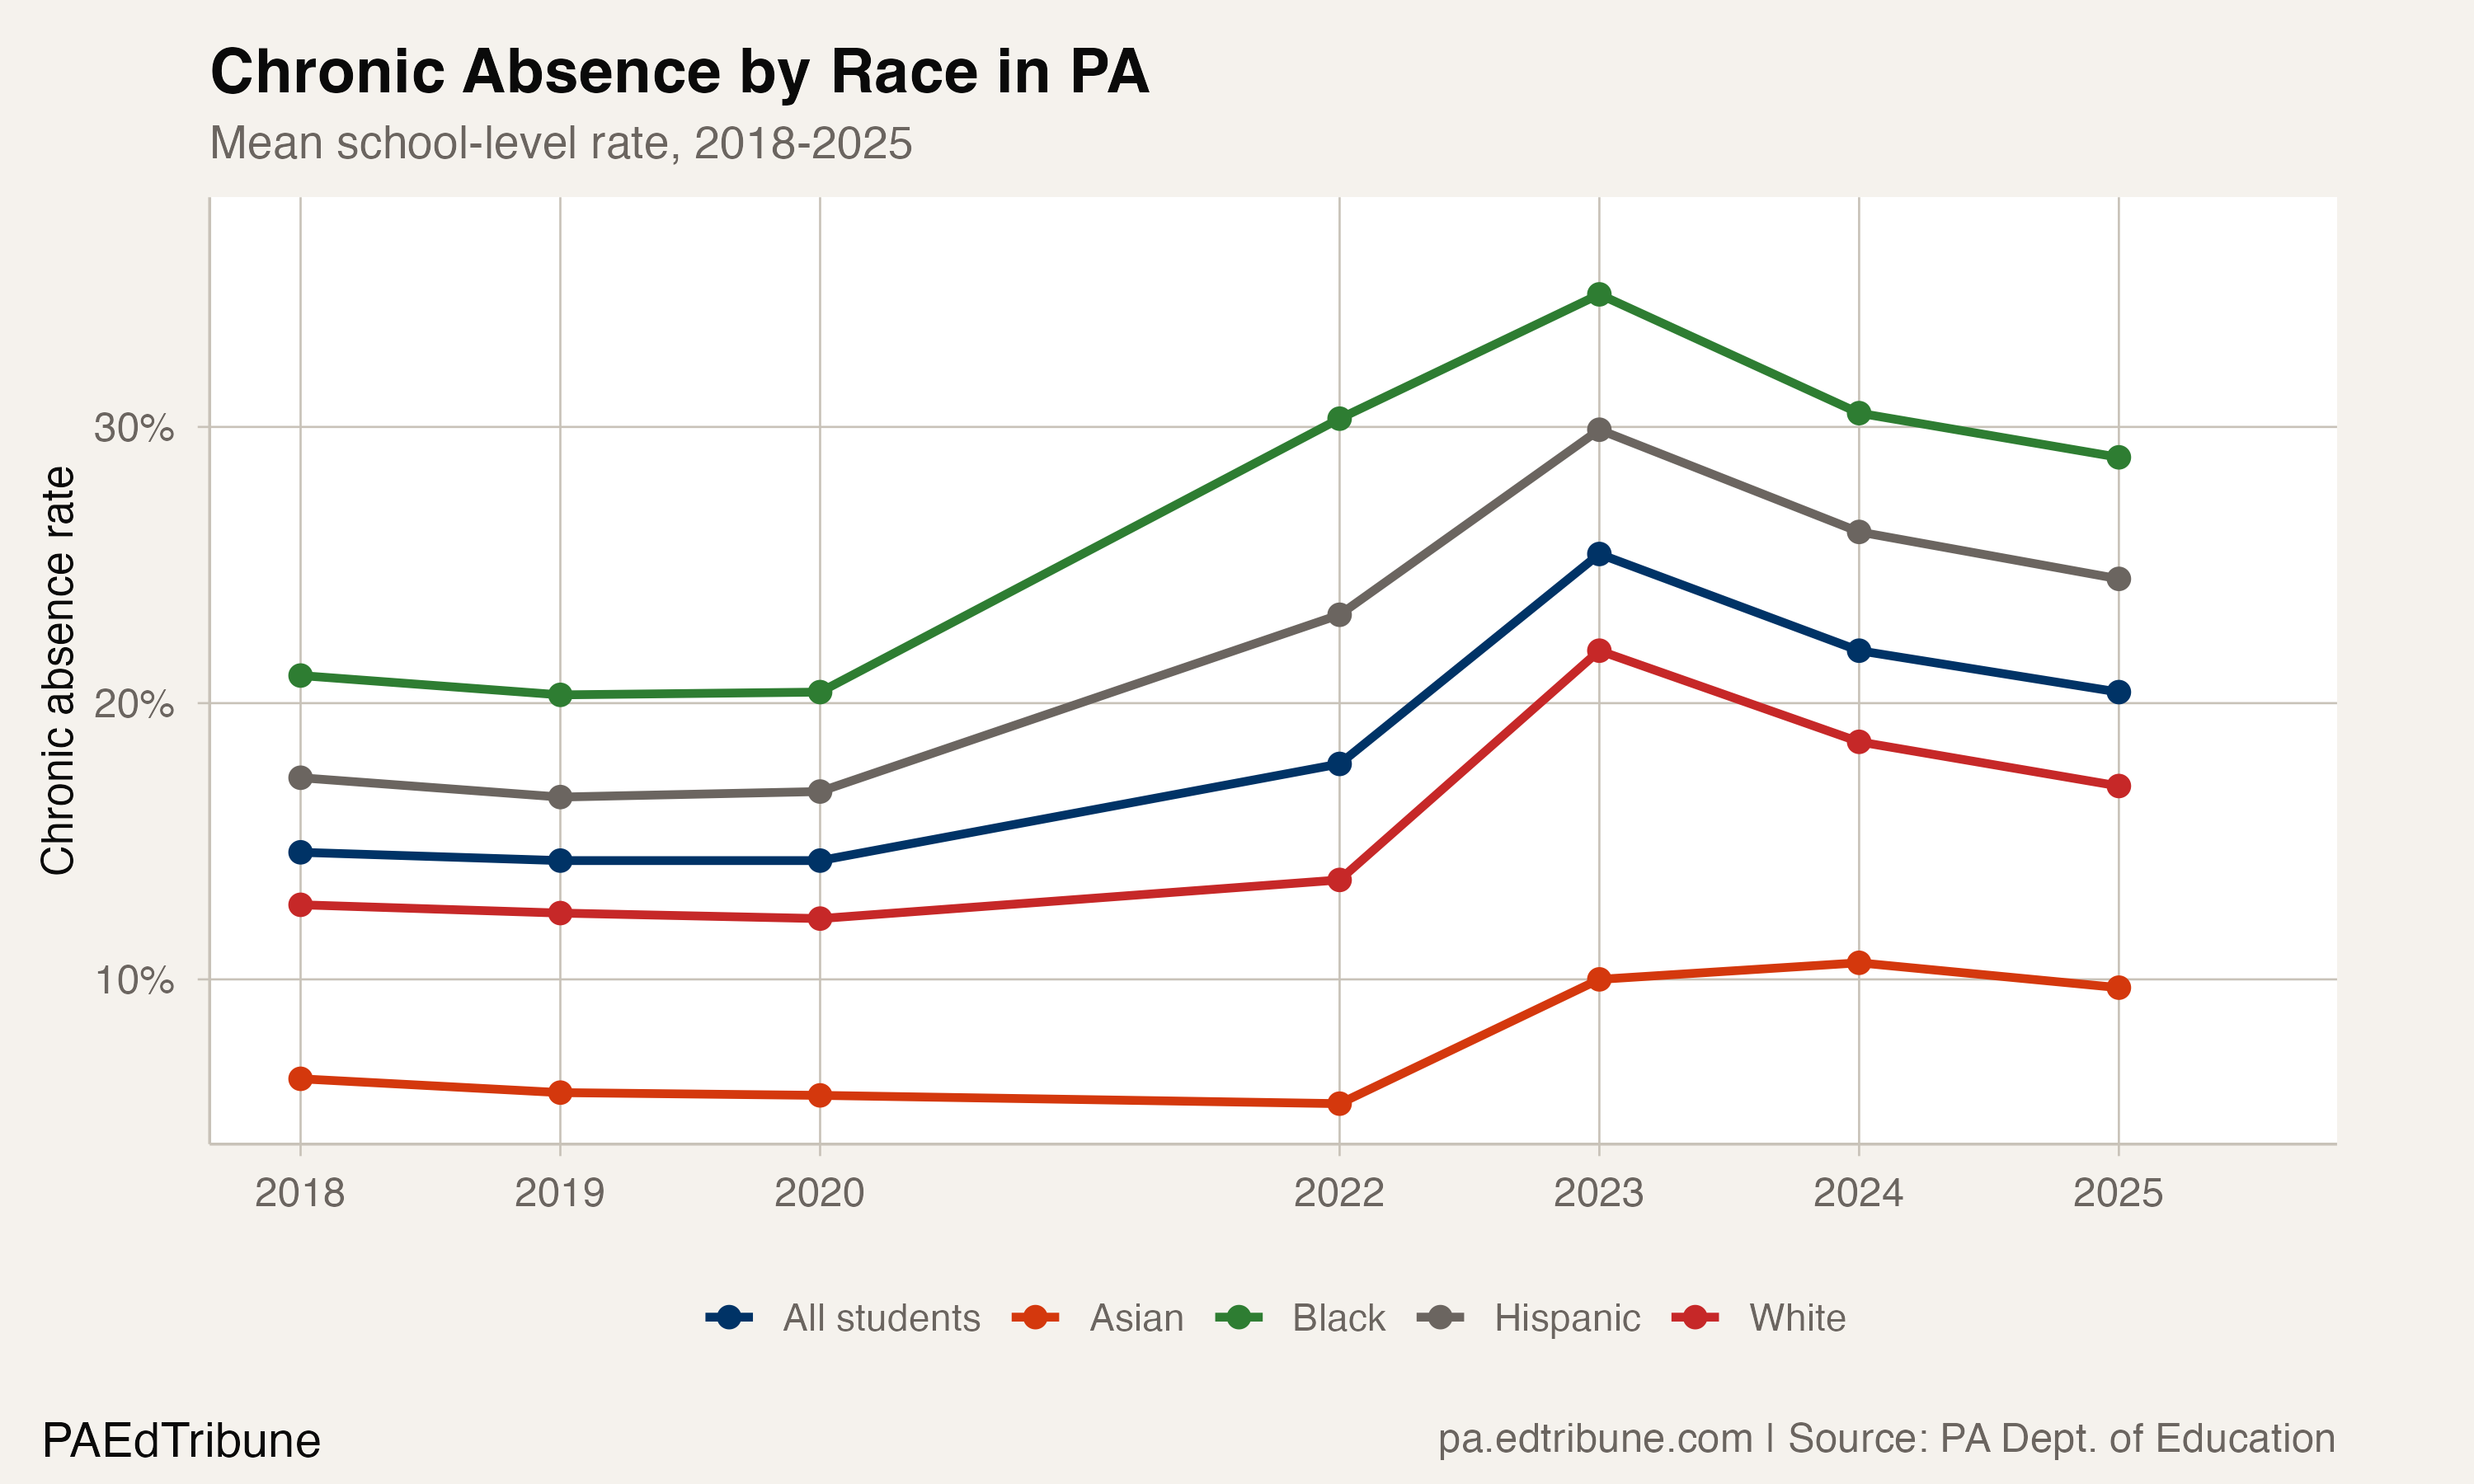
The most revealing year in the data is 2021-22, the first full year back. White chronic absence rose from 12.2% to 13.6%, a 1.4-point increase. Black chronic absence rose from 20.4% to 30.3%, a 9.9-point increase. Whatever happened during COVID, the return to school buildings, the disruption to family routines, the loss of community supports, it affected Black students nearly seven times more severely by this measure.
Asian students experienced the smallest impact of any group. Their rate went from 7.5% pre-COVID to 6.3% in 2022, actually improving through the pandemic. By 2025, it had risen to 9.7%, still the lowest of any group but the only one whose 2025 rate represents a worsening from its 2022 level.
National analysis by FutureEd found that students who experienced the largest pandemic-era attendance increases, overwhelmingly Black and Hispanic children and those from low-income families, are the furthest from their pre-pandemic levels and that in many states the gaps have widened rather than narrowed.
Service populations: overlapping but distinct
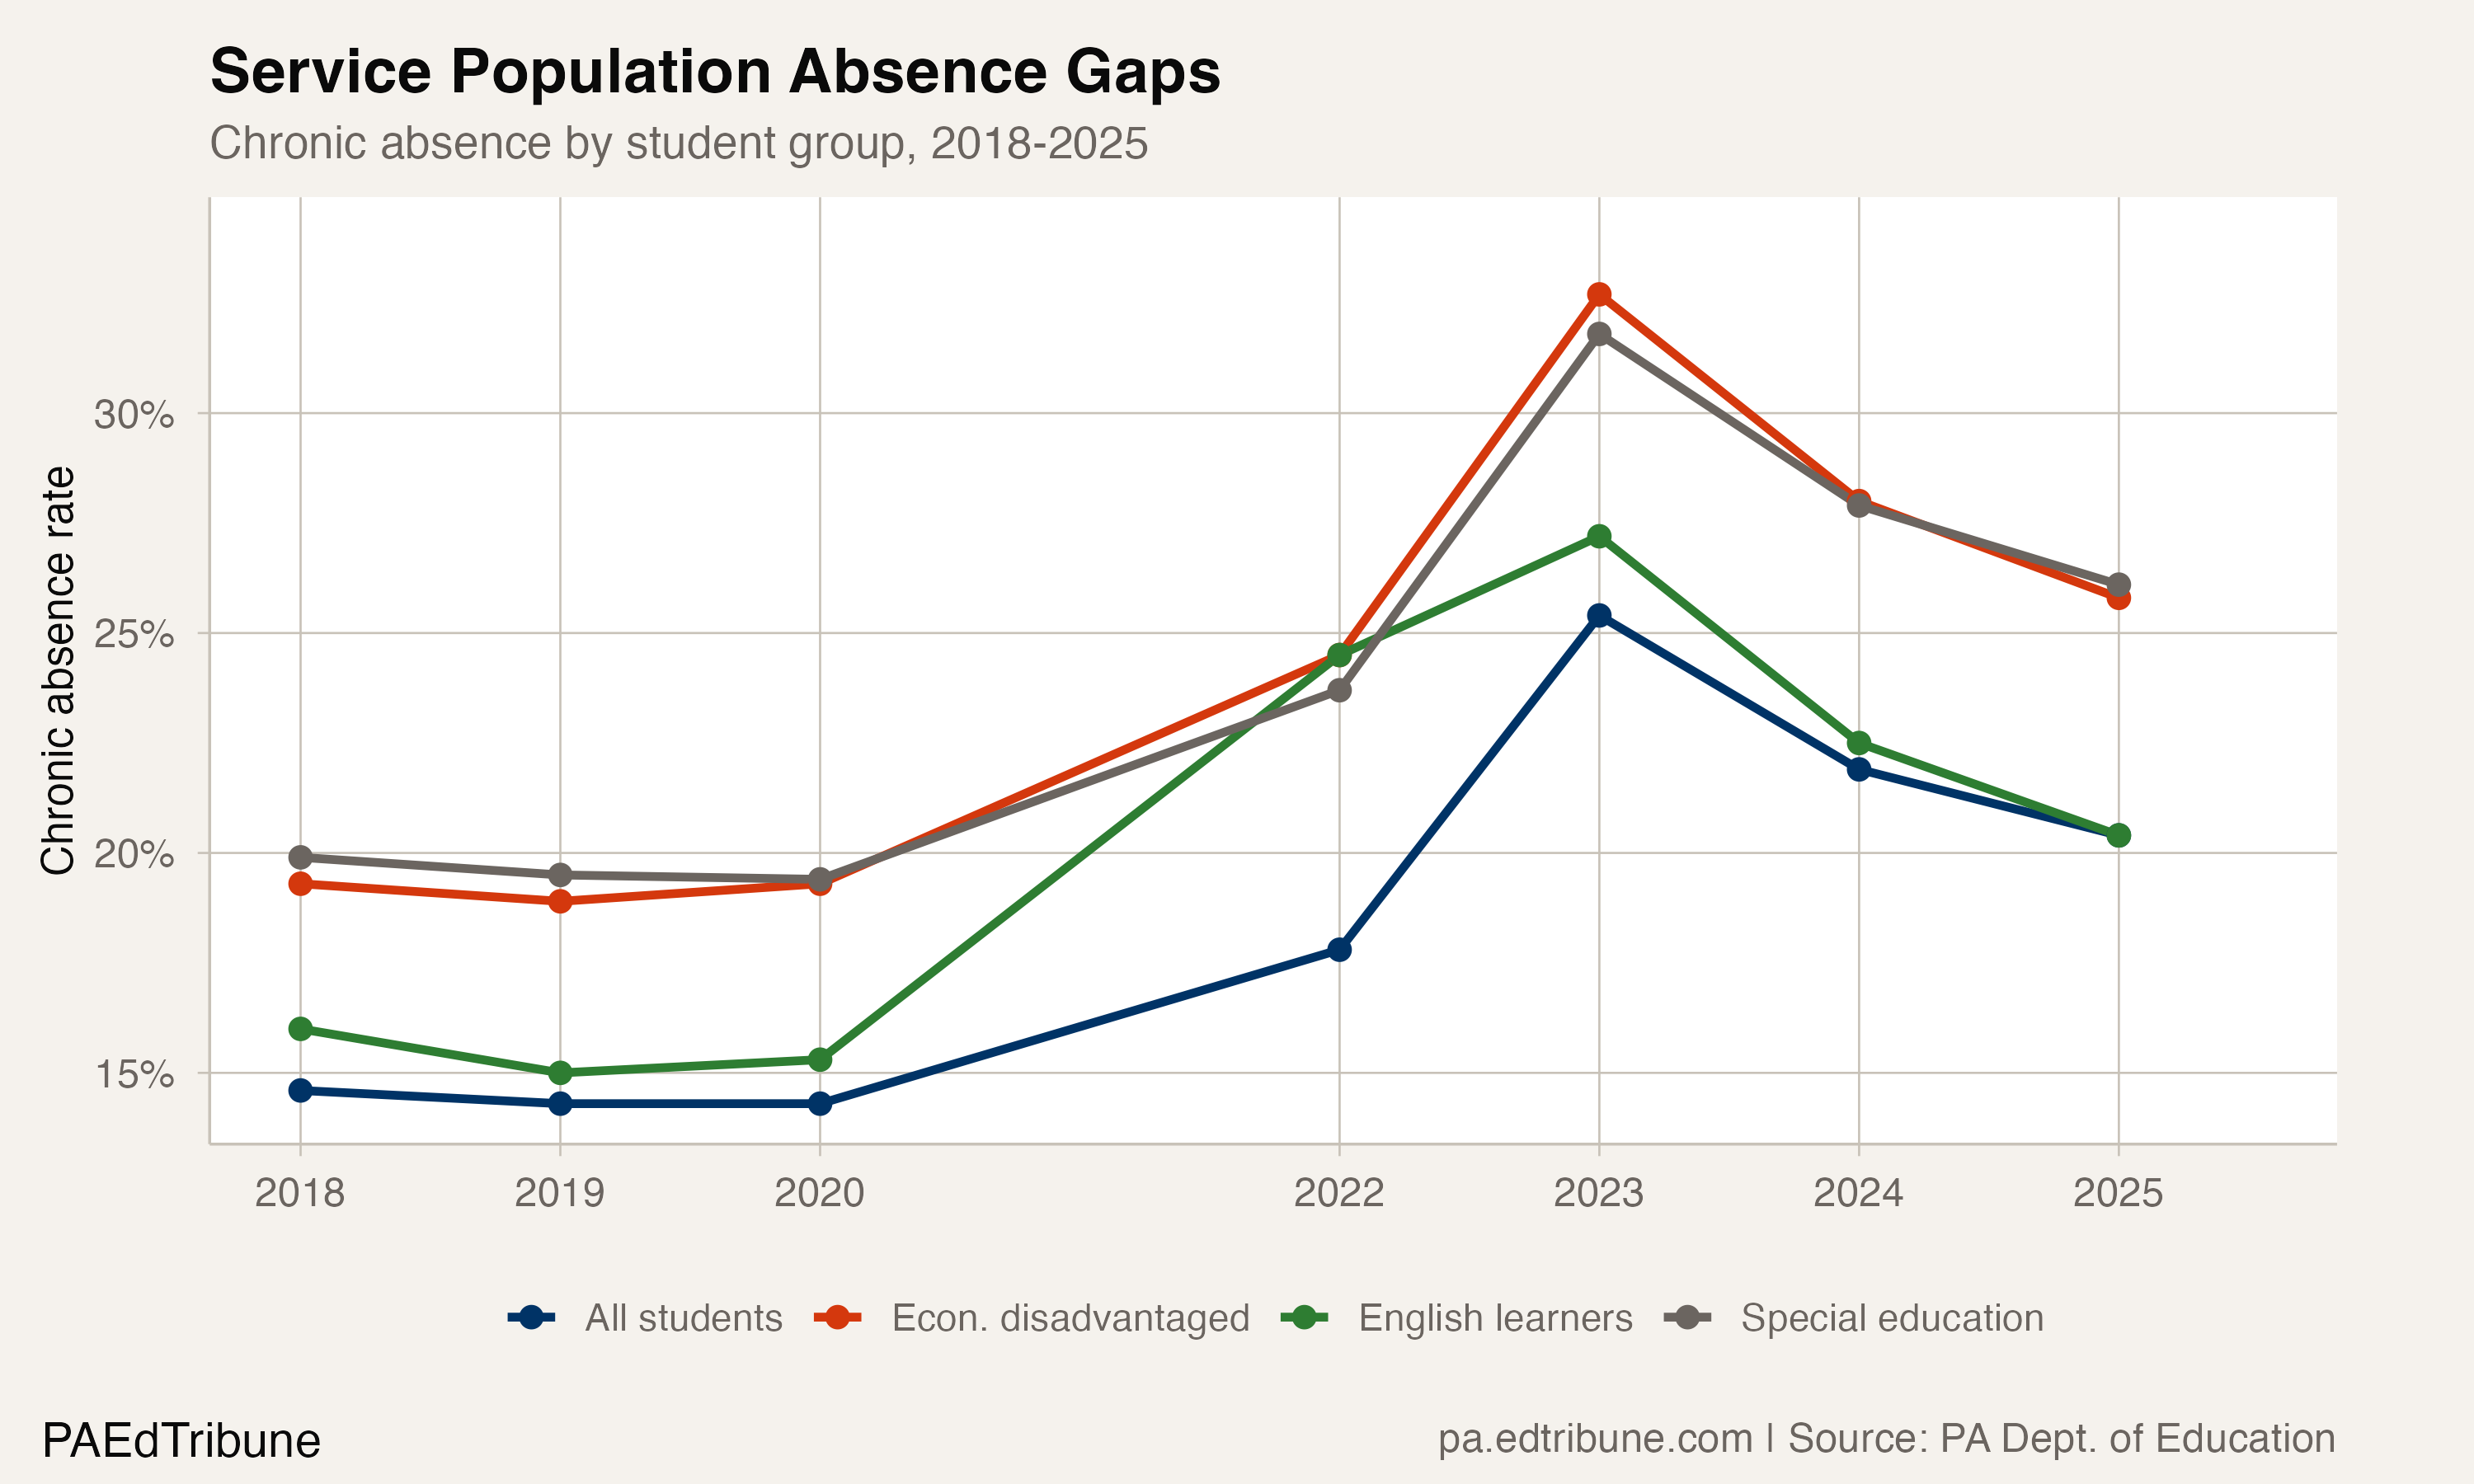
Economically disadvantaged students have a chronic absence rate of 25.8% in 2024-25, 5.4 points above the state average. Students receiving special education services are at 26.1%, 5.7 points above. Both gaps widened from their pre-COVID levels.
These service population categories overlap substantially with each other and with racial categories. Many economically disadvantaged students are also Black or Hispanic. Many special education students are also economically disadvantaged. The gaps do not stack. A student who is Black, economically disadvantaged, and receiving special education services is counted once in each category but is one student facing compounding barriers.
The poverty-absence connection strengthened during COVID. Before the pandemic, the gap between economically disadvantaged students and the overall rate was 5.0 points. It peaked at 7.3 points in 2023 and has narrowed slightly to 5.4 in 2025. The special education gap followed the same trajectory: 4.4 points pre-COVID, peaking at 6.6 in 2023, now at 5.7.
The English learner exception
English learner students in Pennsylvania tell a different story. Their chronic absence rate was 15.3% in 2018, 1.0 percentage point above the overall rate. In 2025, it is 20.4%, exactly matching the statewide mean. While every other group's gap widened, English learners' gap closed.
The explanation is not that English learner absence improved dramatically. It rose during COVID like everyone else's. What happened is that English learner rates improved at a slightly faster pace during the recovery, pulling their rate down to the mean. In 2023, English learners were at 25.7% while the state was at 25.4%, a negligible difference. By 2025, both had converged to 20.4%.
Whether this reflects specific supports for English learner families, cultural factors around school attendance in immigrant communities, or simply regression to the mean is not clear from the rate data alone. Pennsylvania does not publicly attribute this convergence to any specific program.
What closing the gap would require
The Black-white gap was 8.2 points in 2020. Getting back to that level, not eliminating the gap entirely, just returning it to its pre-COVID width, would require either a 3.7-point faster decline in Black chronic absence than white, or some combination from both sides. In the most recent year, Black absence fell 1.6 points while white absence fell 1.6 points. The gap did not move at all between 2024 and 2025.
Between 2024 and 2025, Black chronic absence fell 1.6 points. White chronic absence fell 1.6 points. The gap did not move. Parallel improvement is recovery. Converging improvement is equity. Pennsylvania has the first but not the second.
Detailed code that reproduces the analysis and figures in this article is available exclusively to EdTribune subscribers.
Discussion
Sign in to join the discussion.
Loading comments...