In the 2022-23 school year, York City SD recorded the highest chronic absence rate of any major district in Pennsylvania: 63.4%. Nearly two out of three students were missing enough school to be considered chronically absent.
Two years later, it is 36.8%. That is a 26.6-point drop, the second-largest recovery in the state behind Coatesville Area SD. And unlike Coatesville's sudden single-year plunge, York City's improvement has been steady: 22 points from 2023 to 2024, then another 4.6 from 2024 to 2025.
The decline and recovery
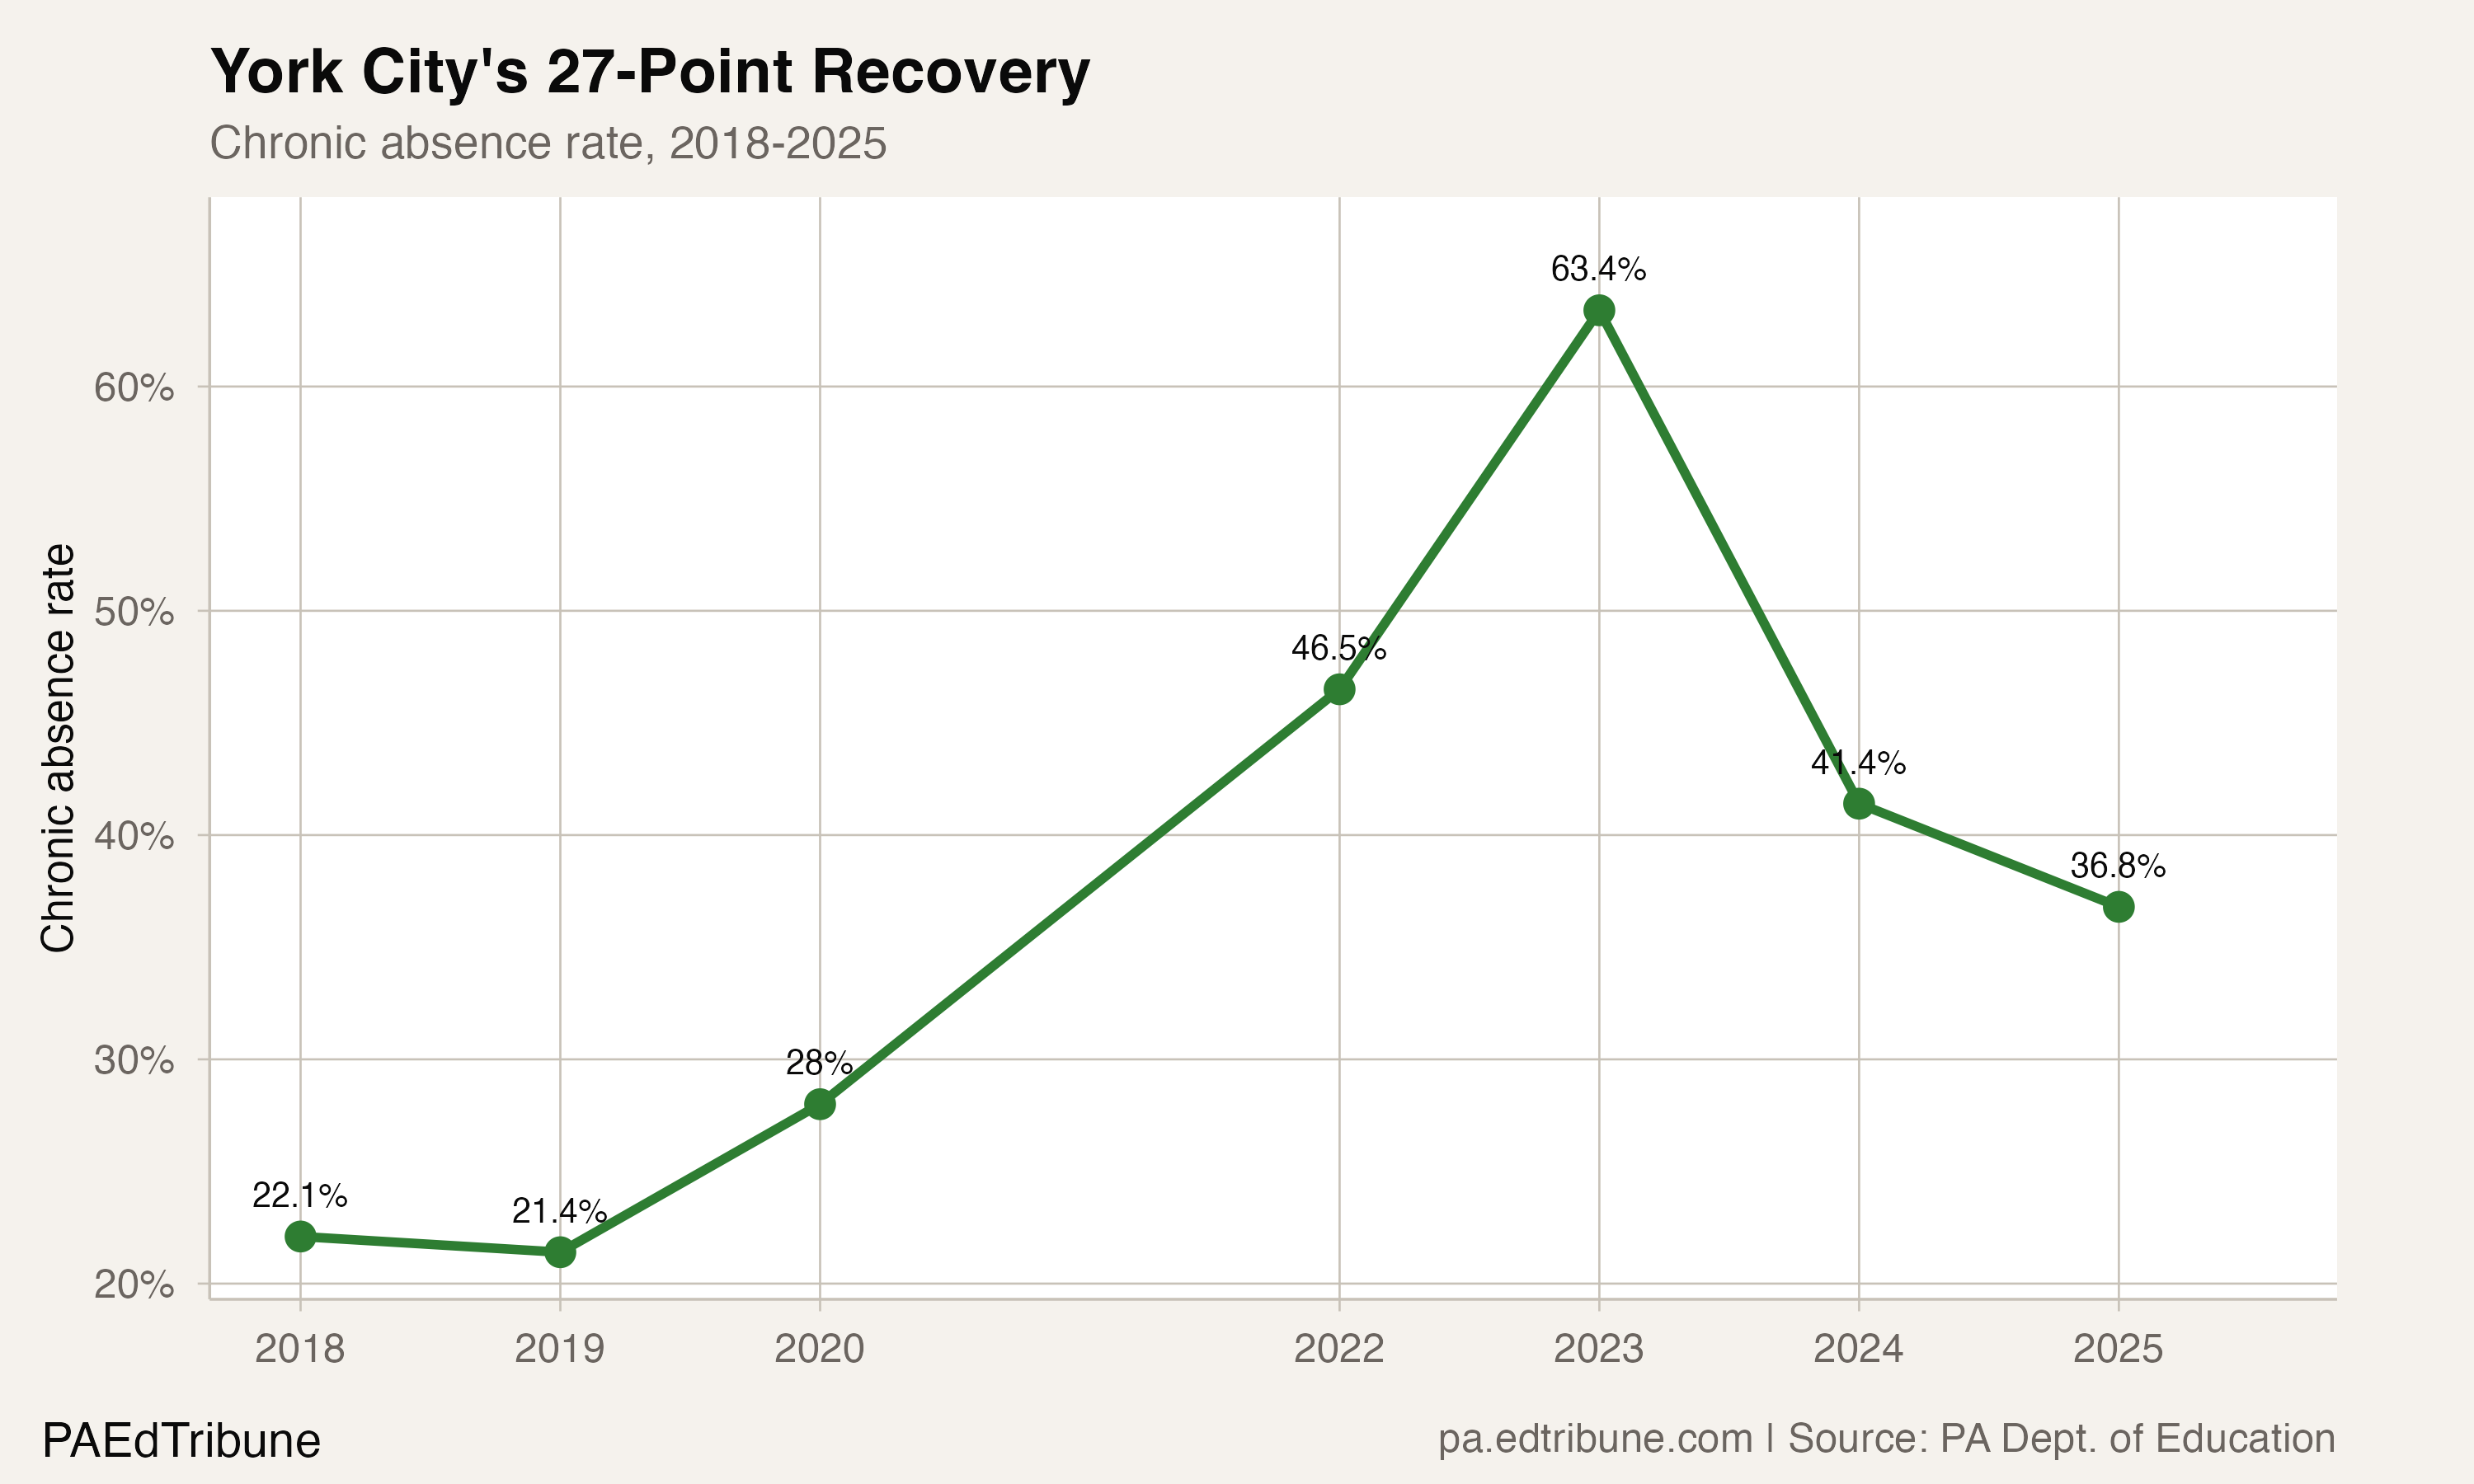
York City's attendance history has two distinct eras. Before COVID, the district's chronic absence rate was in the low 20s: 22.1% in 2018, 21.4% in 2019. It rose to 28.0% in the truncated 2019-20 year. Then the pandemic hit. When schools reopened fully in 2021-22, the rate jumped to 46.5%. A year later it peaked at 63.4%.
The recovery began immediately. York City dropped from 63.4% to 41.4% in a single year (2023 to 2024), an improvement of 22 points. The pace slowed in 2024-25 (41.4% to 36.8%, a 4.6-point gain), but the trajectory remains downward. At 36.8%, the district is still 14.7 points above its pre-COVID baseline of 22.1%, but it has closed 62% of the gap between its peak and that baseline.
Recovery across every group
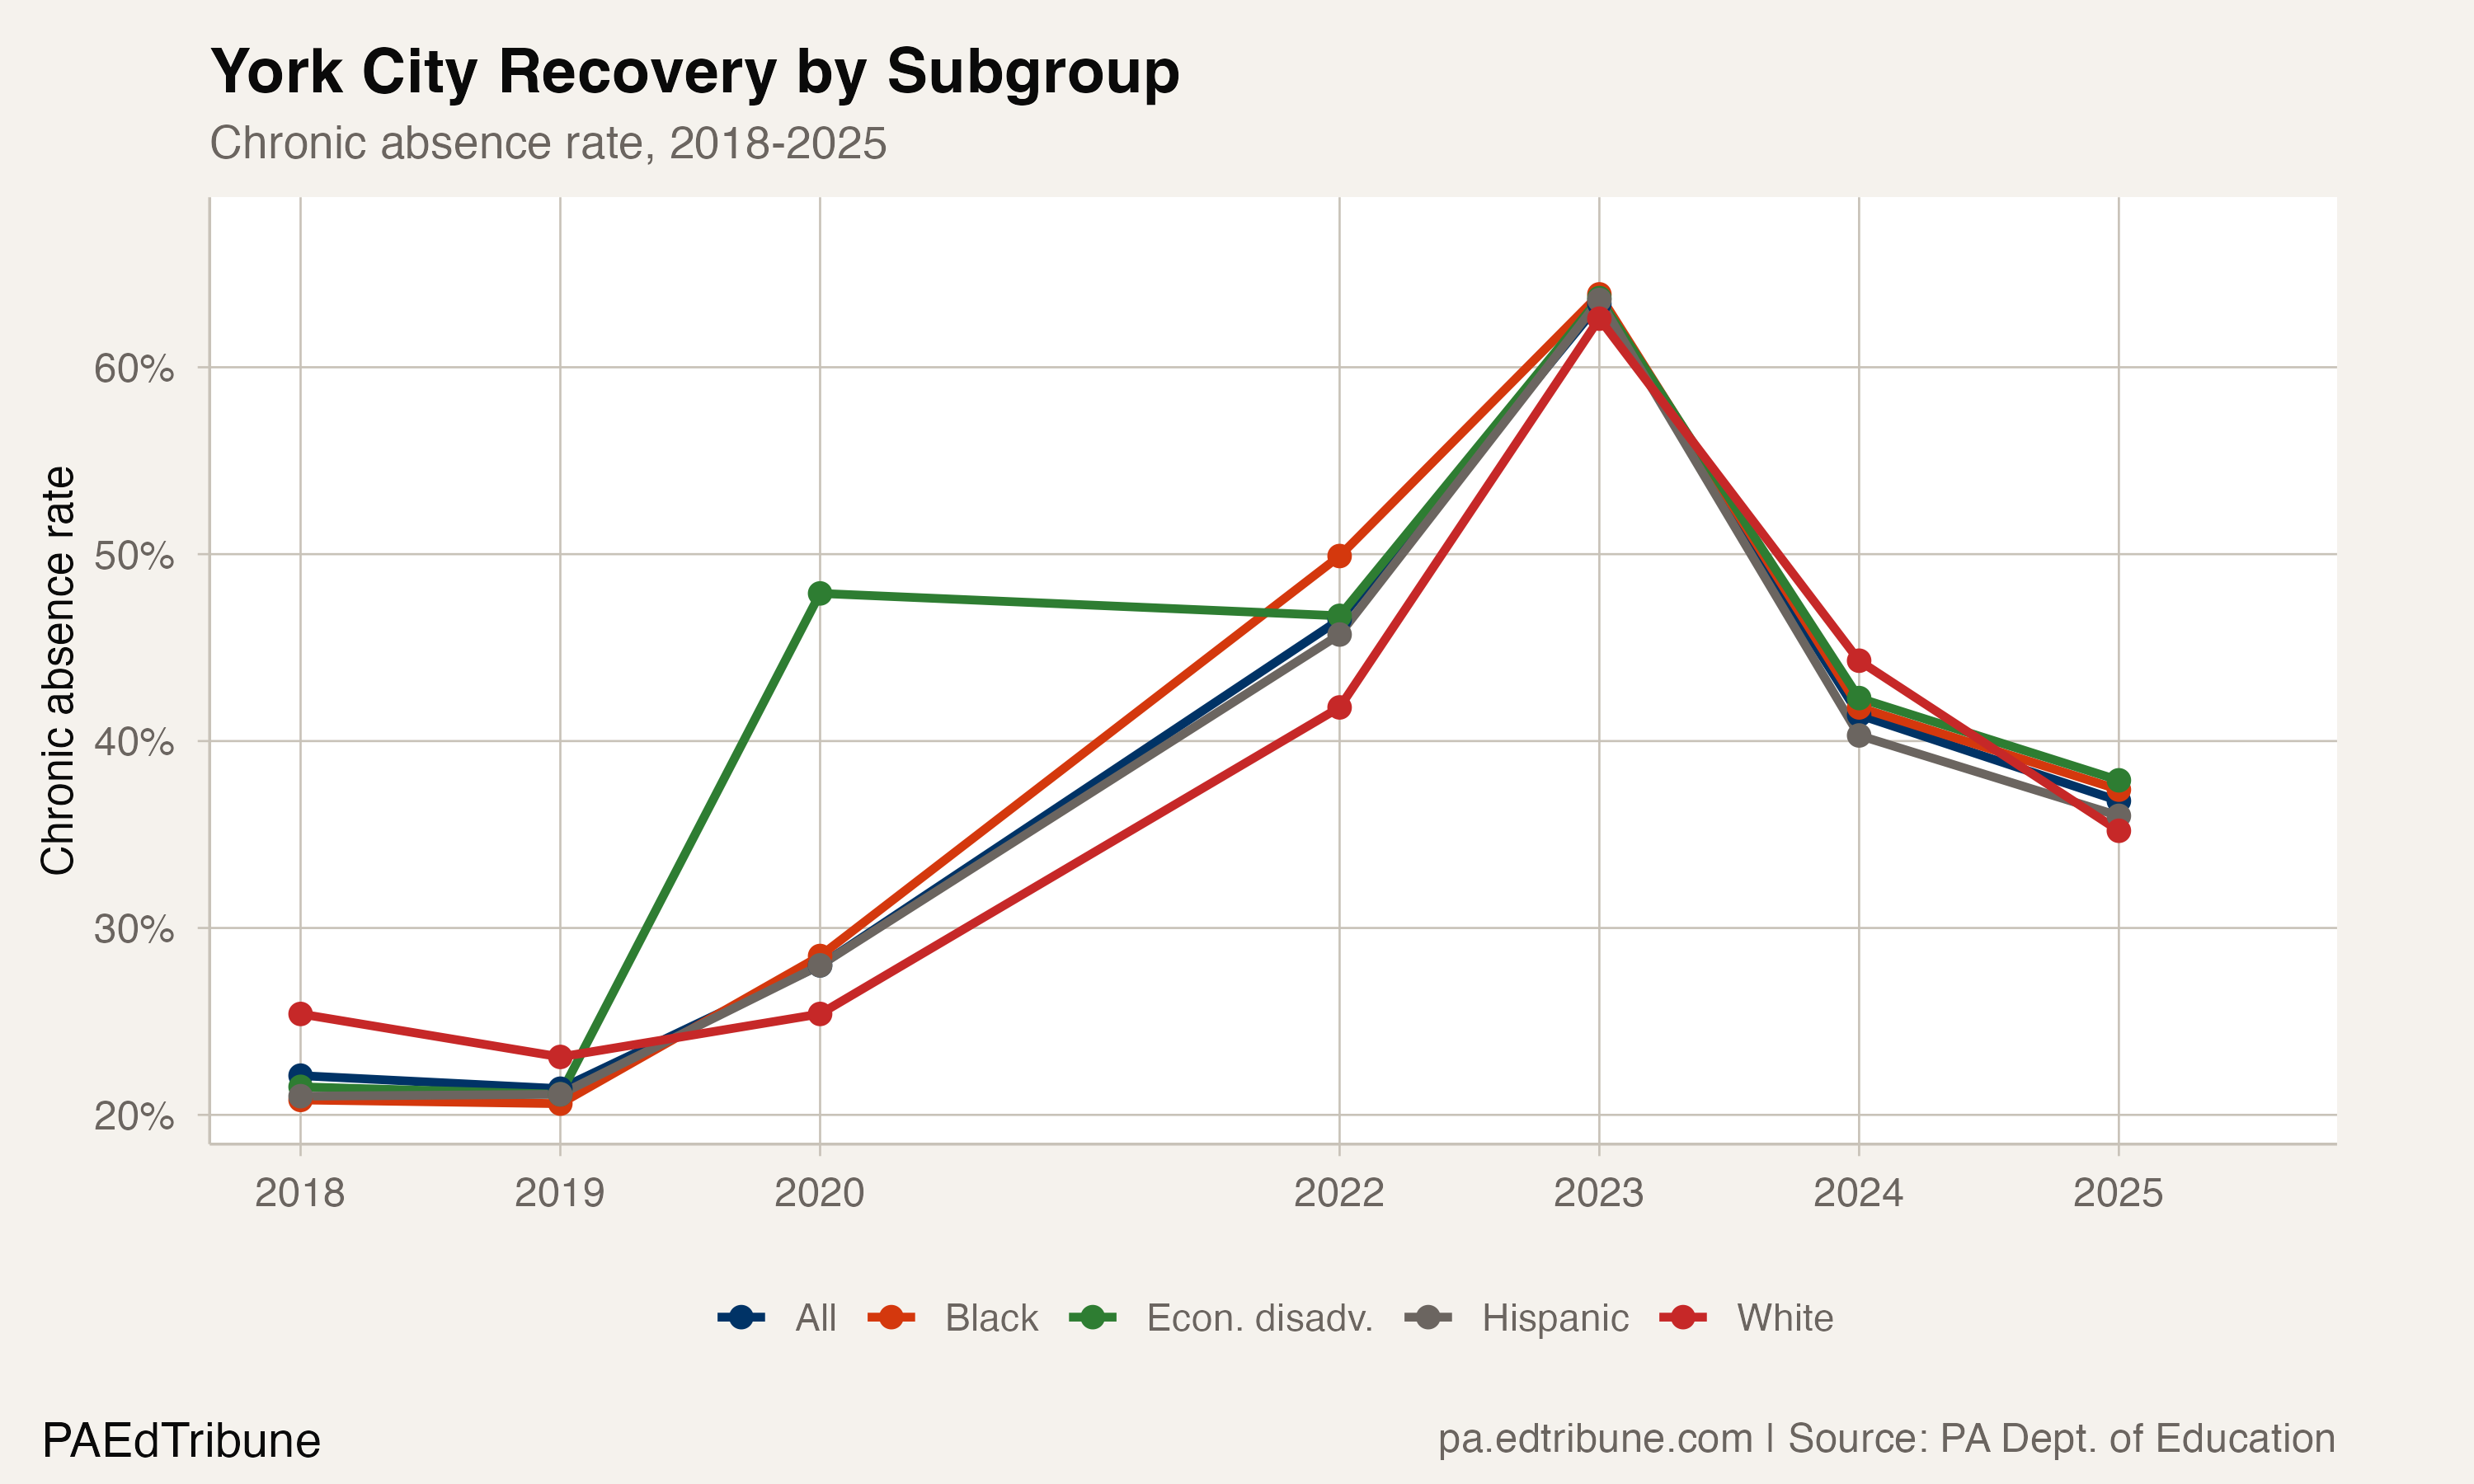
The subgroup data adds credibility to the recovery. If improvement were driven by wealthier families returning or a demographic shift, the gains would be concentrated in one or two groups. Instead, every subgroup tracked downward in parallel:
- All students: 63.4% to 36.8%
- Black students: peaked and then fell to 37.5%
- Economically disadvantaged: peaked and then fell to 36.1%
- Hispanic students: peaked and fell to 22.4%
- White students: peaked and fell to 24.4%
Hispanic students now have the lowest chronic absence rate of any group in the district at 22.4%, well below the Black rate of 37.5% and the white rate of 24.4%. Economically disadvantaged students at 36.1% track closely with the overall rate, reflecting the heavy overlap between poverty and the district's demographics.
Still far from normal
The 36.8% rate is not a success story by statewide standards. The state average is 20.4%. York City is still nearly double that. More than one in three students is missing enough school to fall behind academically.
But context matters. Among districts that hit 50% or higher during the COVID spike, York City's recovery is exceptional. Chester-Upland (57.3%), Greater Johnstown (57.8%), and McKeesport (55.4%) remain above 50%. Harrisburg, the state capital, peaked at 64.8% and is still at 48.4%. York City's peer districts have recovered an average of 5 to 10 points from their peaks. York City recovered 26.6.
What the data does not explain
York City SD has not publicly attributed its attendance improvement to a specific program or initiative. No district press release, board presentation, or local news coverage identifies a named intervention. The RAND Corporation's national survey of attendance strategies found that effective districts typically combine targeted outreach (text messages, home visits), removal of barriers (transportation, school supplies), and relationship-building between families and schools. Whether York City adopted these specific strategies or found different ones is not visible in the public record.
What is visible is that the improvement was rapid, broad-based, and sustained over two years. Those characteristics suggest a systemic change rather than statistical noise or a data artifact. York City is still at 36.8%. That is not normal. But it is 27 points better than two years ago, and every subgroup moved in the same direction. Whatever happened in this district, it was not statistical noise and it was not a demographic shift. It was something that worked. Nobody has said what.
Detailed code that reproduces the analysis and figures in this article is available exclusively to EdTribune subscribers.
Discussion
Sign in to join the discussion.
Loading comments...