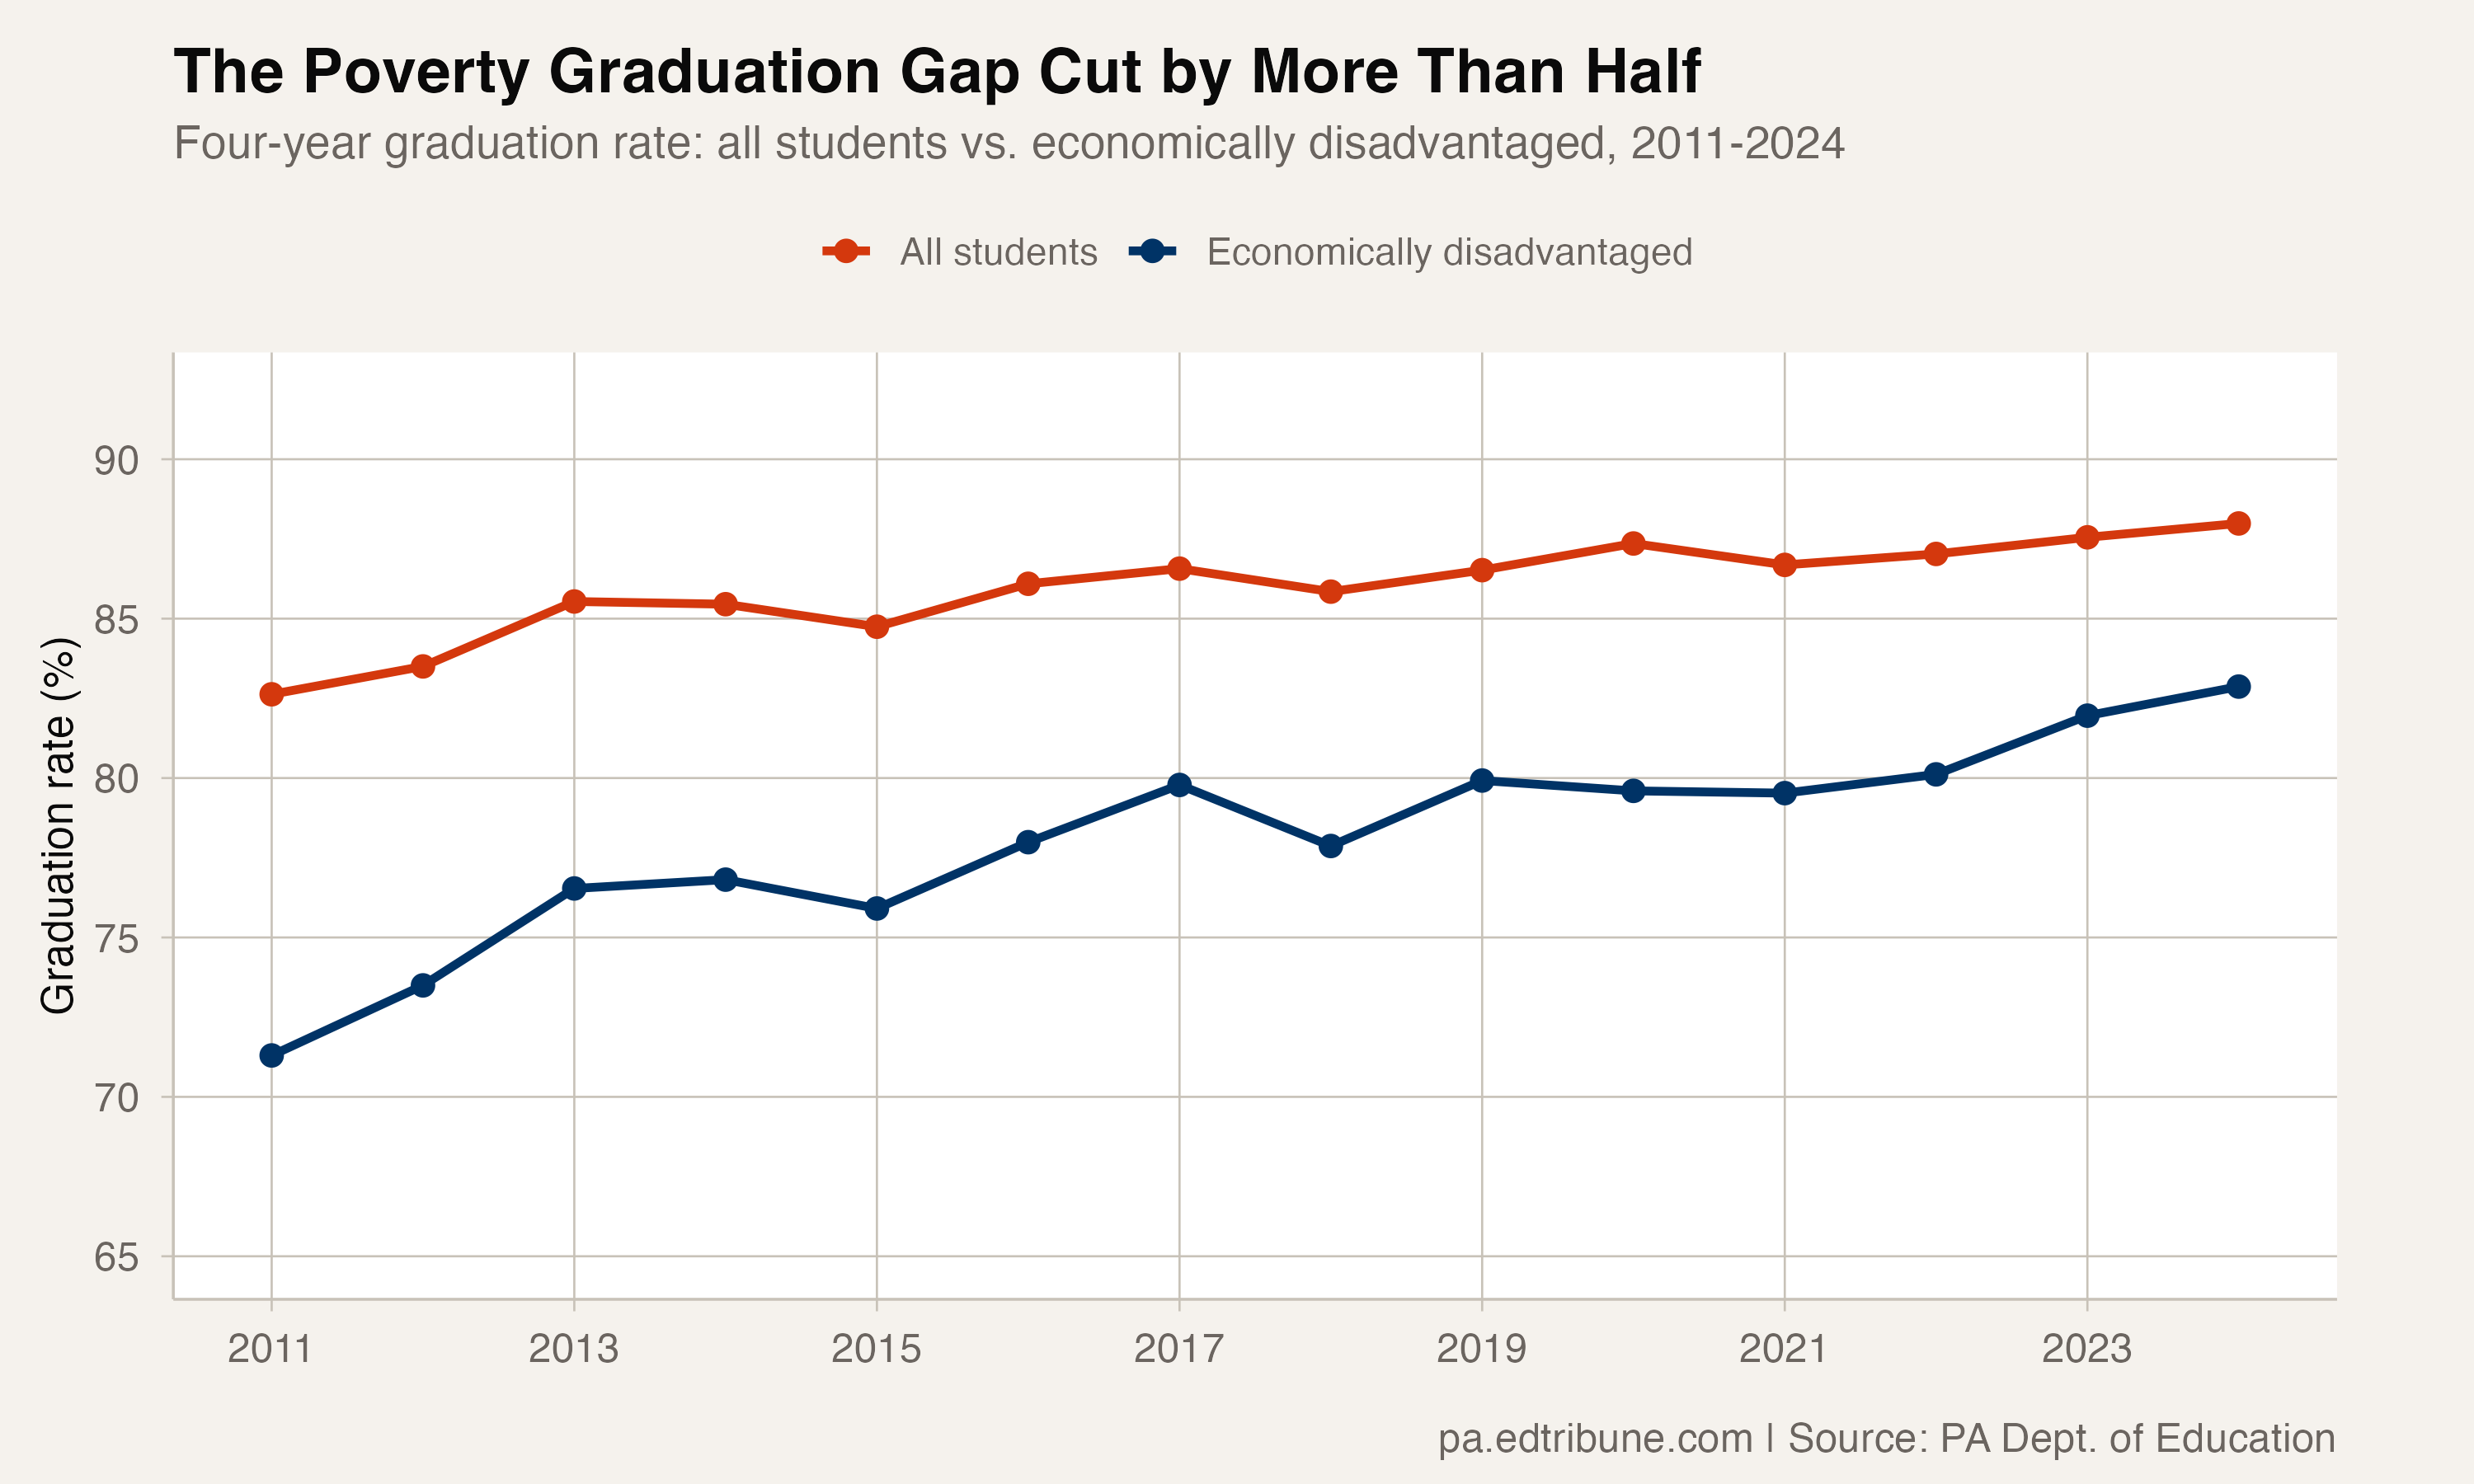
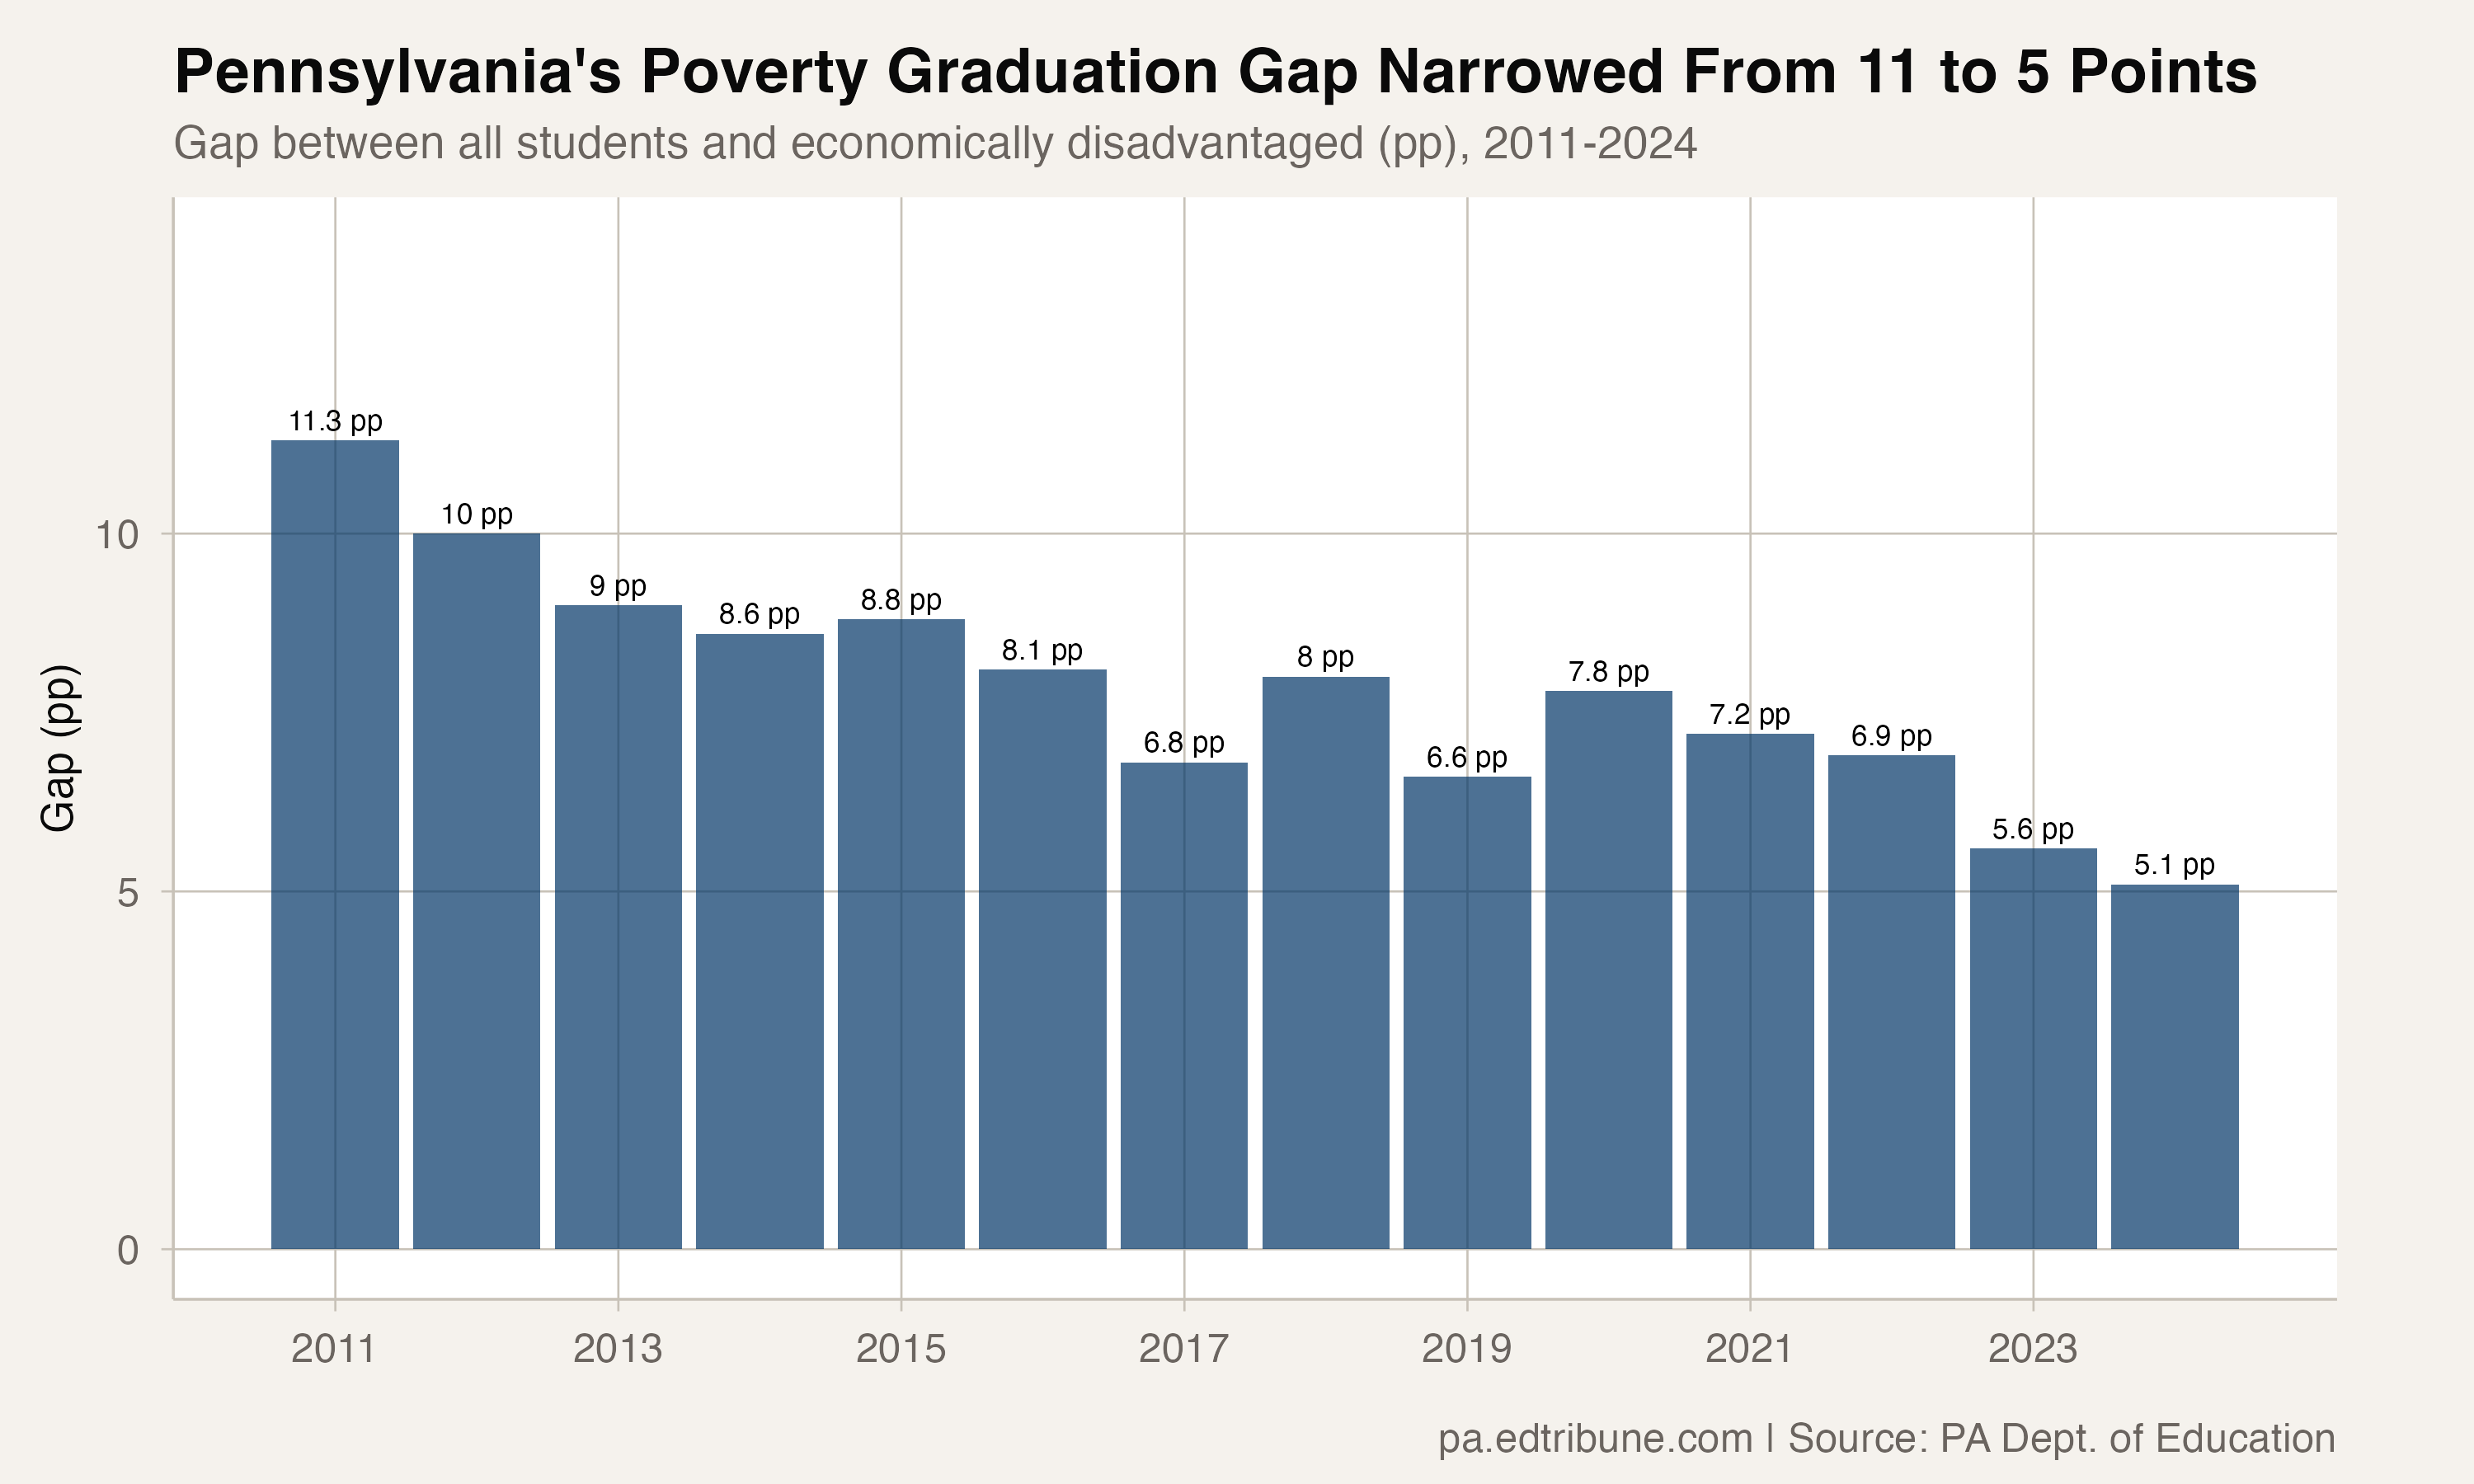
Pennsylvania's economically disadvantaged students graduated at 82.9% in 2024, up from 71.3% in 2011. That 11.6 percentage point improvement outpaced the state's overall gain of 5.4 points, narrowing the poverty gap from 11.3 percentage points to 5.1 — a 55% reduction.
That matters in a state that ranked No. 49 nationally in the income-based opportunity gap in a Research for Action analysis reported by Chalkbeat. The graduation data is one equity indicator moving in the right direction.
The convergence
The gap narrowed in two phases. From 2011 to 2017, economically disadvantaged students gained 8.5 percentage points while all students gained 3.9 — a rapid convergence that brought the gap from 11.3 to 6.8 points.
From 2018 to 2024, progress was choppier. The gap widened to 7.8 points in 2020, then narrowed in the two most recent years of the package data — from 6.9 in 2022 to 5.6 in 2023 to 5.1 in 2024. The 2024 gap is the smallest in the 14-year dataset.
What 5 points means
A 5.1 point gap means that for every 100 economically disadvantaged students in the four-year cohort, about five fewer graduate on time than if the group matched the statewide overall rate. That is still a meaningful disparity, but it is less than half what it was 13 years ago.
The 82.9% rate for students classified as economically disadvantaged in 2024 exceeds the overall state graduation rate from 2011 (82.6%). In absolute terms, that subgroup graduated in 2024 at a slightly higher rate than all Pennsylvania students did at the start of the period.
The CEP caveat
There is an important qualification. The analysis file is direct evidence for the graduation-rate change, but it is not proof that every part of the change reflects improved outcomes for the same mix of students.
A competing explanation is classification. The U.S. Department of Agriculture describes the Community Eligibility Provision as an option that lets high-poverty schools and districts serve meals at no cost to all enrolled students without collecting household applications, and Pennsylvania's education department describes CEP as a reimbursement option for eligible schools that want to offer free meals to all children in high-poverty schools.
That is suggestive context, not a rebuttal of the trend. The graduation package used for this story does not include CEP fields or subgroup-specific cohort denominators, so this analysis cannot separate true improvement from compositional change inside the "economically disadvantaged" label.
District variation
The statewide figure masks enormous variation at the district level. Philadelphia's economically disadvantaged graduation rate climbed from 56.8% in 2011 to 79.1% in 2024. Pittsburgh's rose from 64.1% to 84.8%.
But in places where the overall rate declined, the subgroup rate often did too. Erie City's economically disadvantaged rate fell from 86.9% in 2011 to 67.4% in 2024.
The package shows the spread clearly: in 2024, 226 of 575 district/entity rows with a non-missing ID and an economically disadvantaged graduation rate were at or above 90%. The state average is real, but it is an average of very different local stories.
Compared to other gaps
Among the state-level graduation gaps checked for this story, the poverty gap's 55% reduction was the largest narrowing, slightly ahead of the white-Black gap (52% reduction) and far ahead of the special education gap, which moved from 12.9 to 12.0 points over seven years.
The white-Hispanic gap narrowed by 44%, and the gender gap remained essentially stable at 4.0 points.
The package can verify the graduation gaps; it cannot identify which mechanism explains the convergence.
Detailed code that reproduces the analysis and figures in this article is available exclusively to EdTribune subscribers.
Discussion
Sign in to join the discussion.
Loading comments...