This article is part of Pennsylvania 2024-25 Chronic AbsenteeismET, a series examining attendance trends across the state.
In the 2021-22 school year, Coatesville Area SD↗ET in Chester County had a chronic absence rate of 50.1%. More students were missing significant school time than not. The Black student rate was 67.0%. The rate for economically disadvantaged students was 63.4%.
Three years later, the district's overall rate is 12.6%, well below the state average of 20.4%. Black students: 18.1%. Economically disadvantaged: 17.5%. White students: 7.1%. Every subgroup improved, and every subgroup is now below the statewide average for its category.
It is the largest such improvement among traditional districts in Pennsylvania.
The trajectory
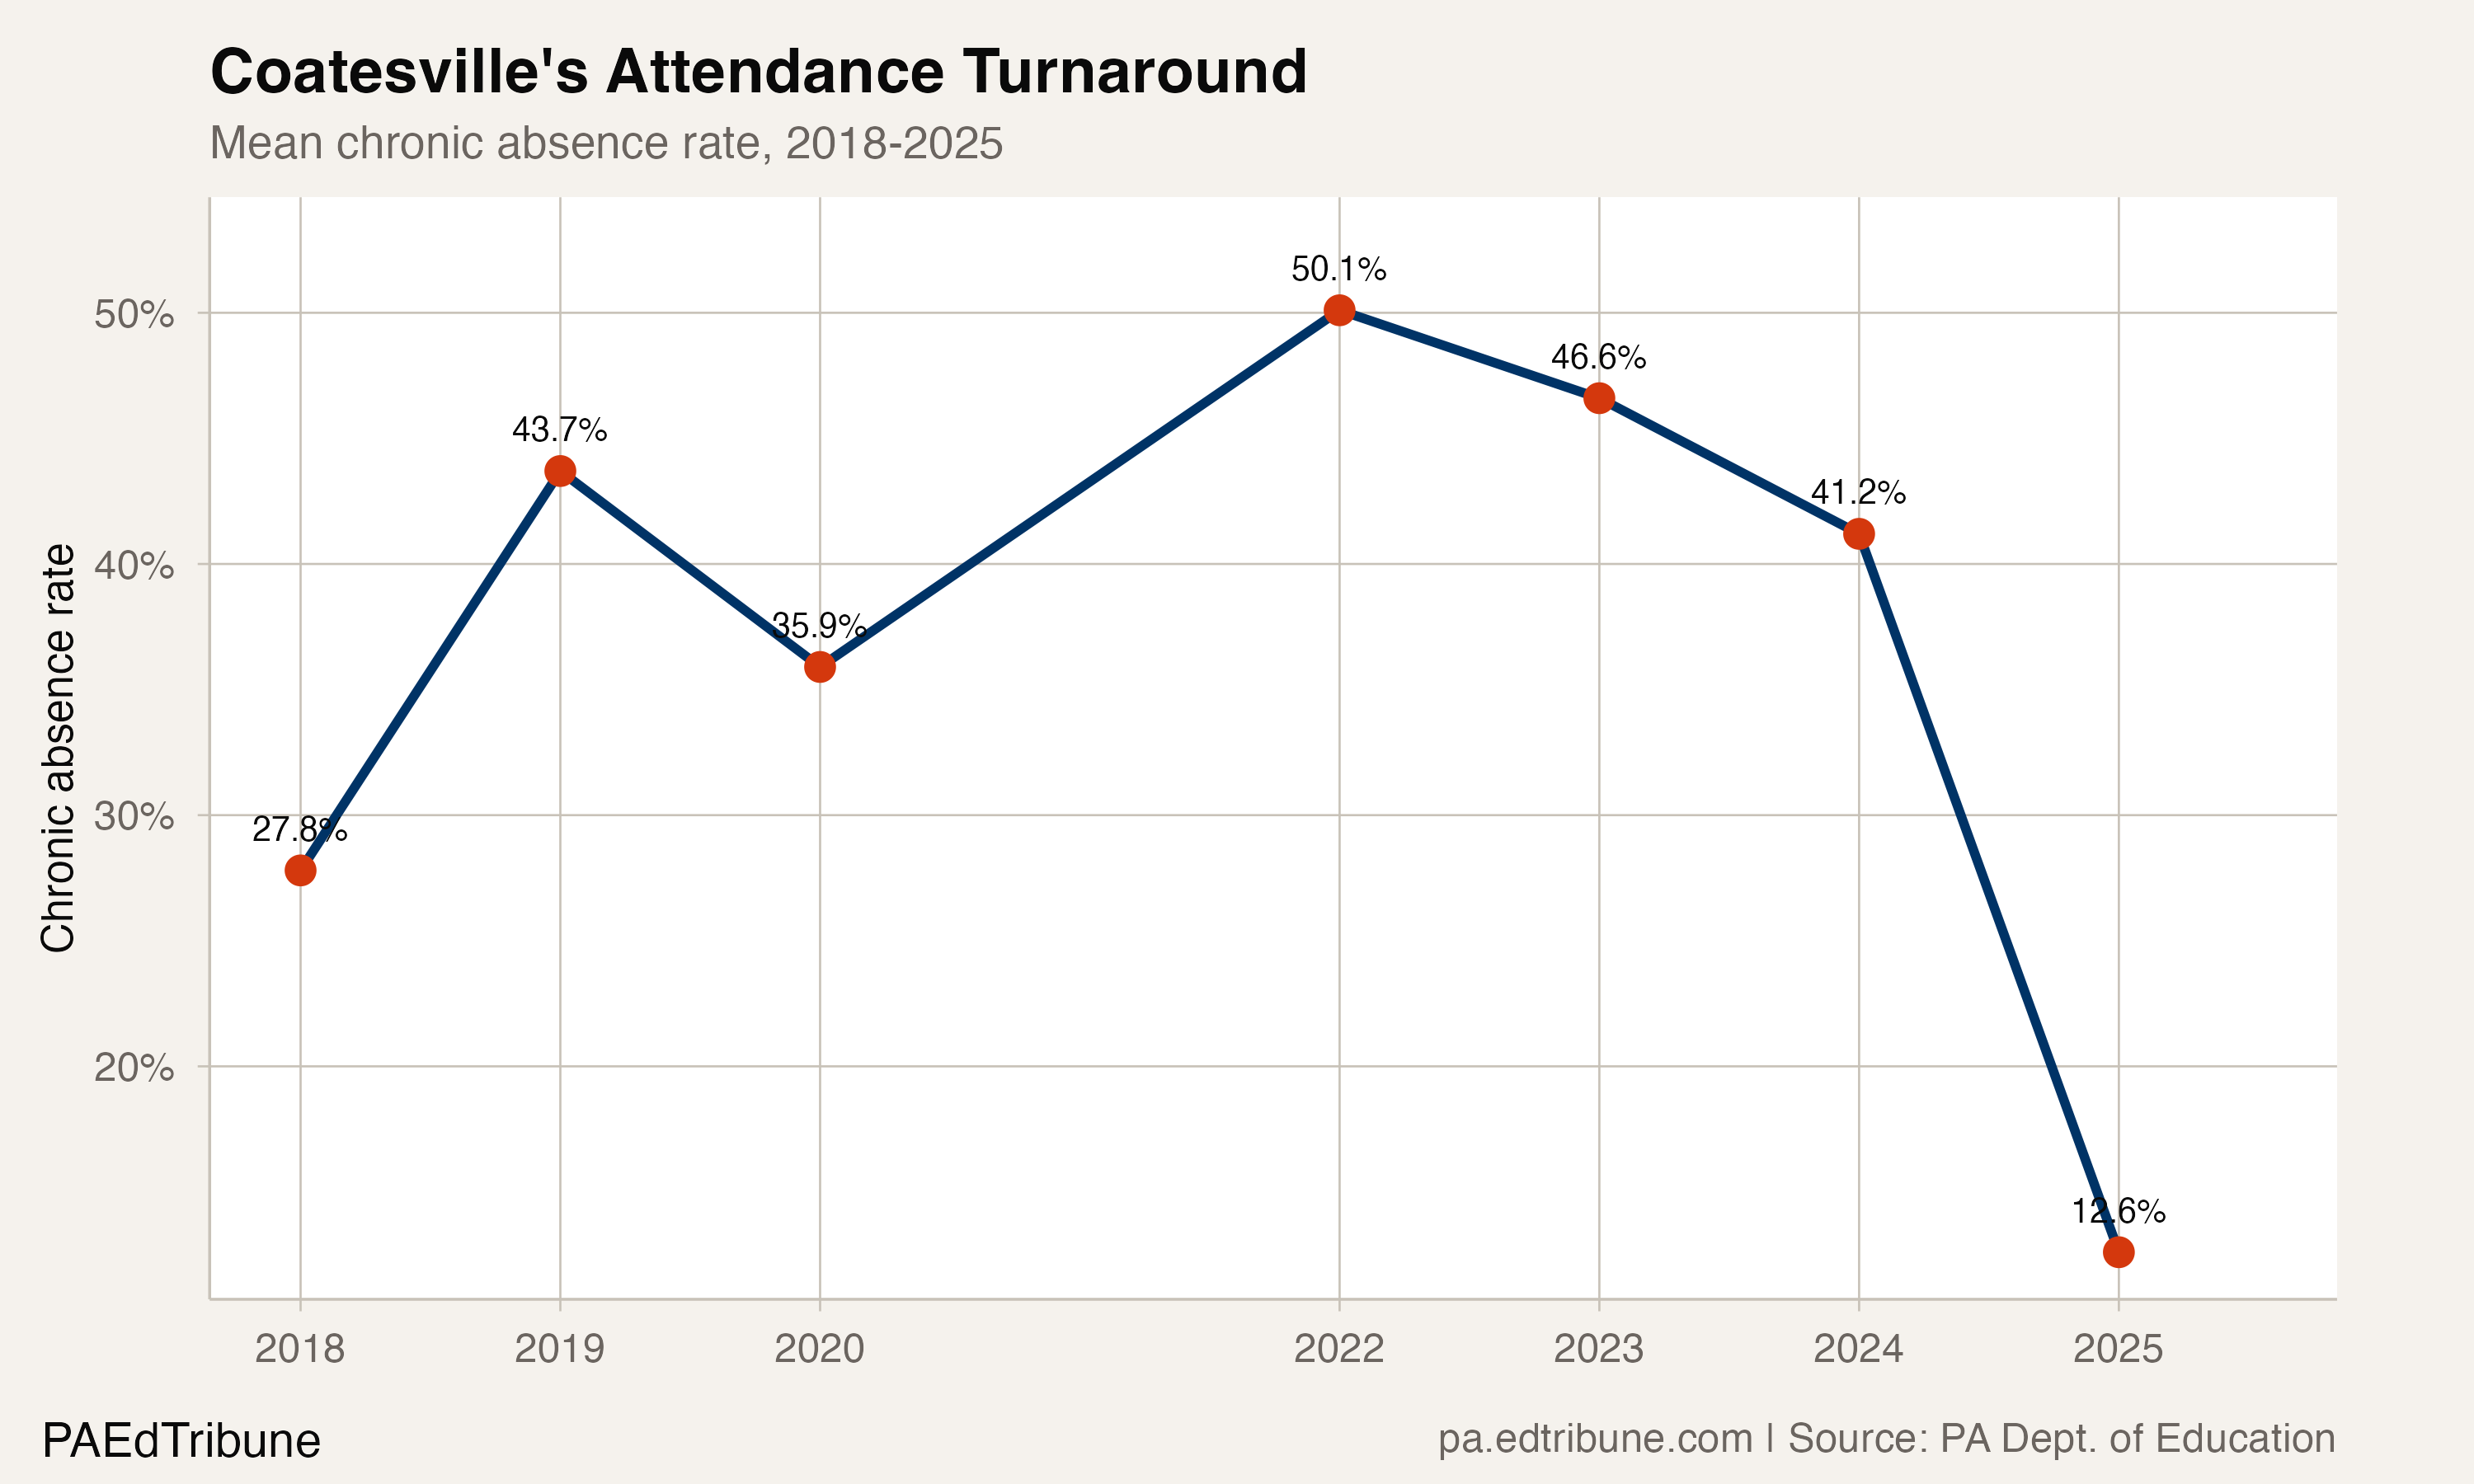
Coatesville's chronic absence history is volatile. The district was at 27.8% in 2018, jumped to 43.7% in 2019, improved to 35.9% in 2020, then hit its worst mark of 50.1% when schools fully reopened after COVID in 2022. What followed was a three-year descent: 46.6% in 2023, 41.2% in 2024, and then a sharp drop to 12.6% in 2025.
The final-year drop is the notable one. The first two years of improvement (50.1% to 41.2%) followed the same trajectory as many districts recovering from the COVID spike. The last year (41.2% to 12.6%, a 28.6-point improvement in a single year) is anomalous. Statewide, the mean improvement was 1.5 points in 2024-25.
All subgroups moved together
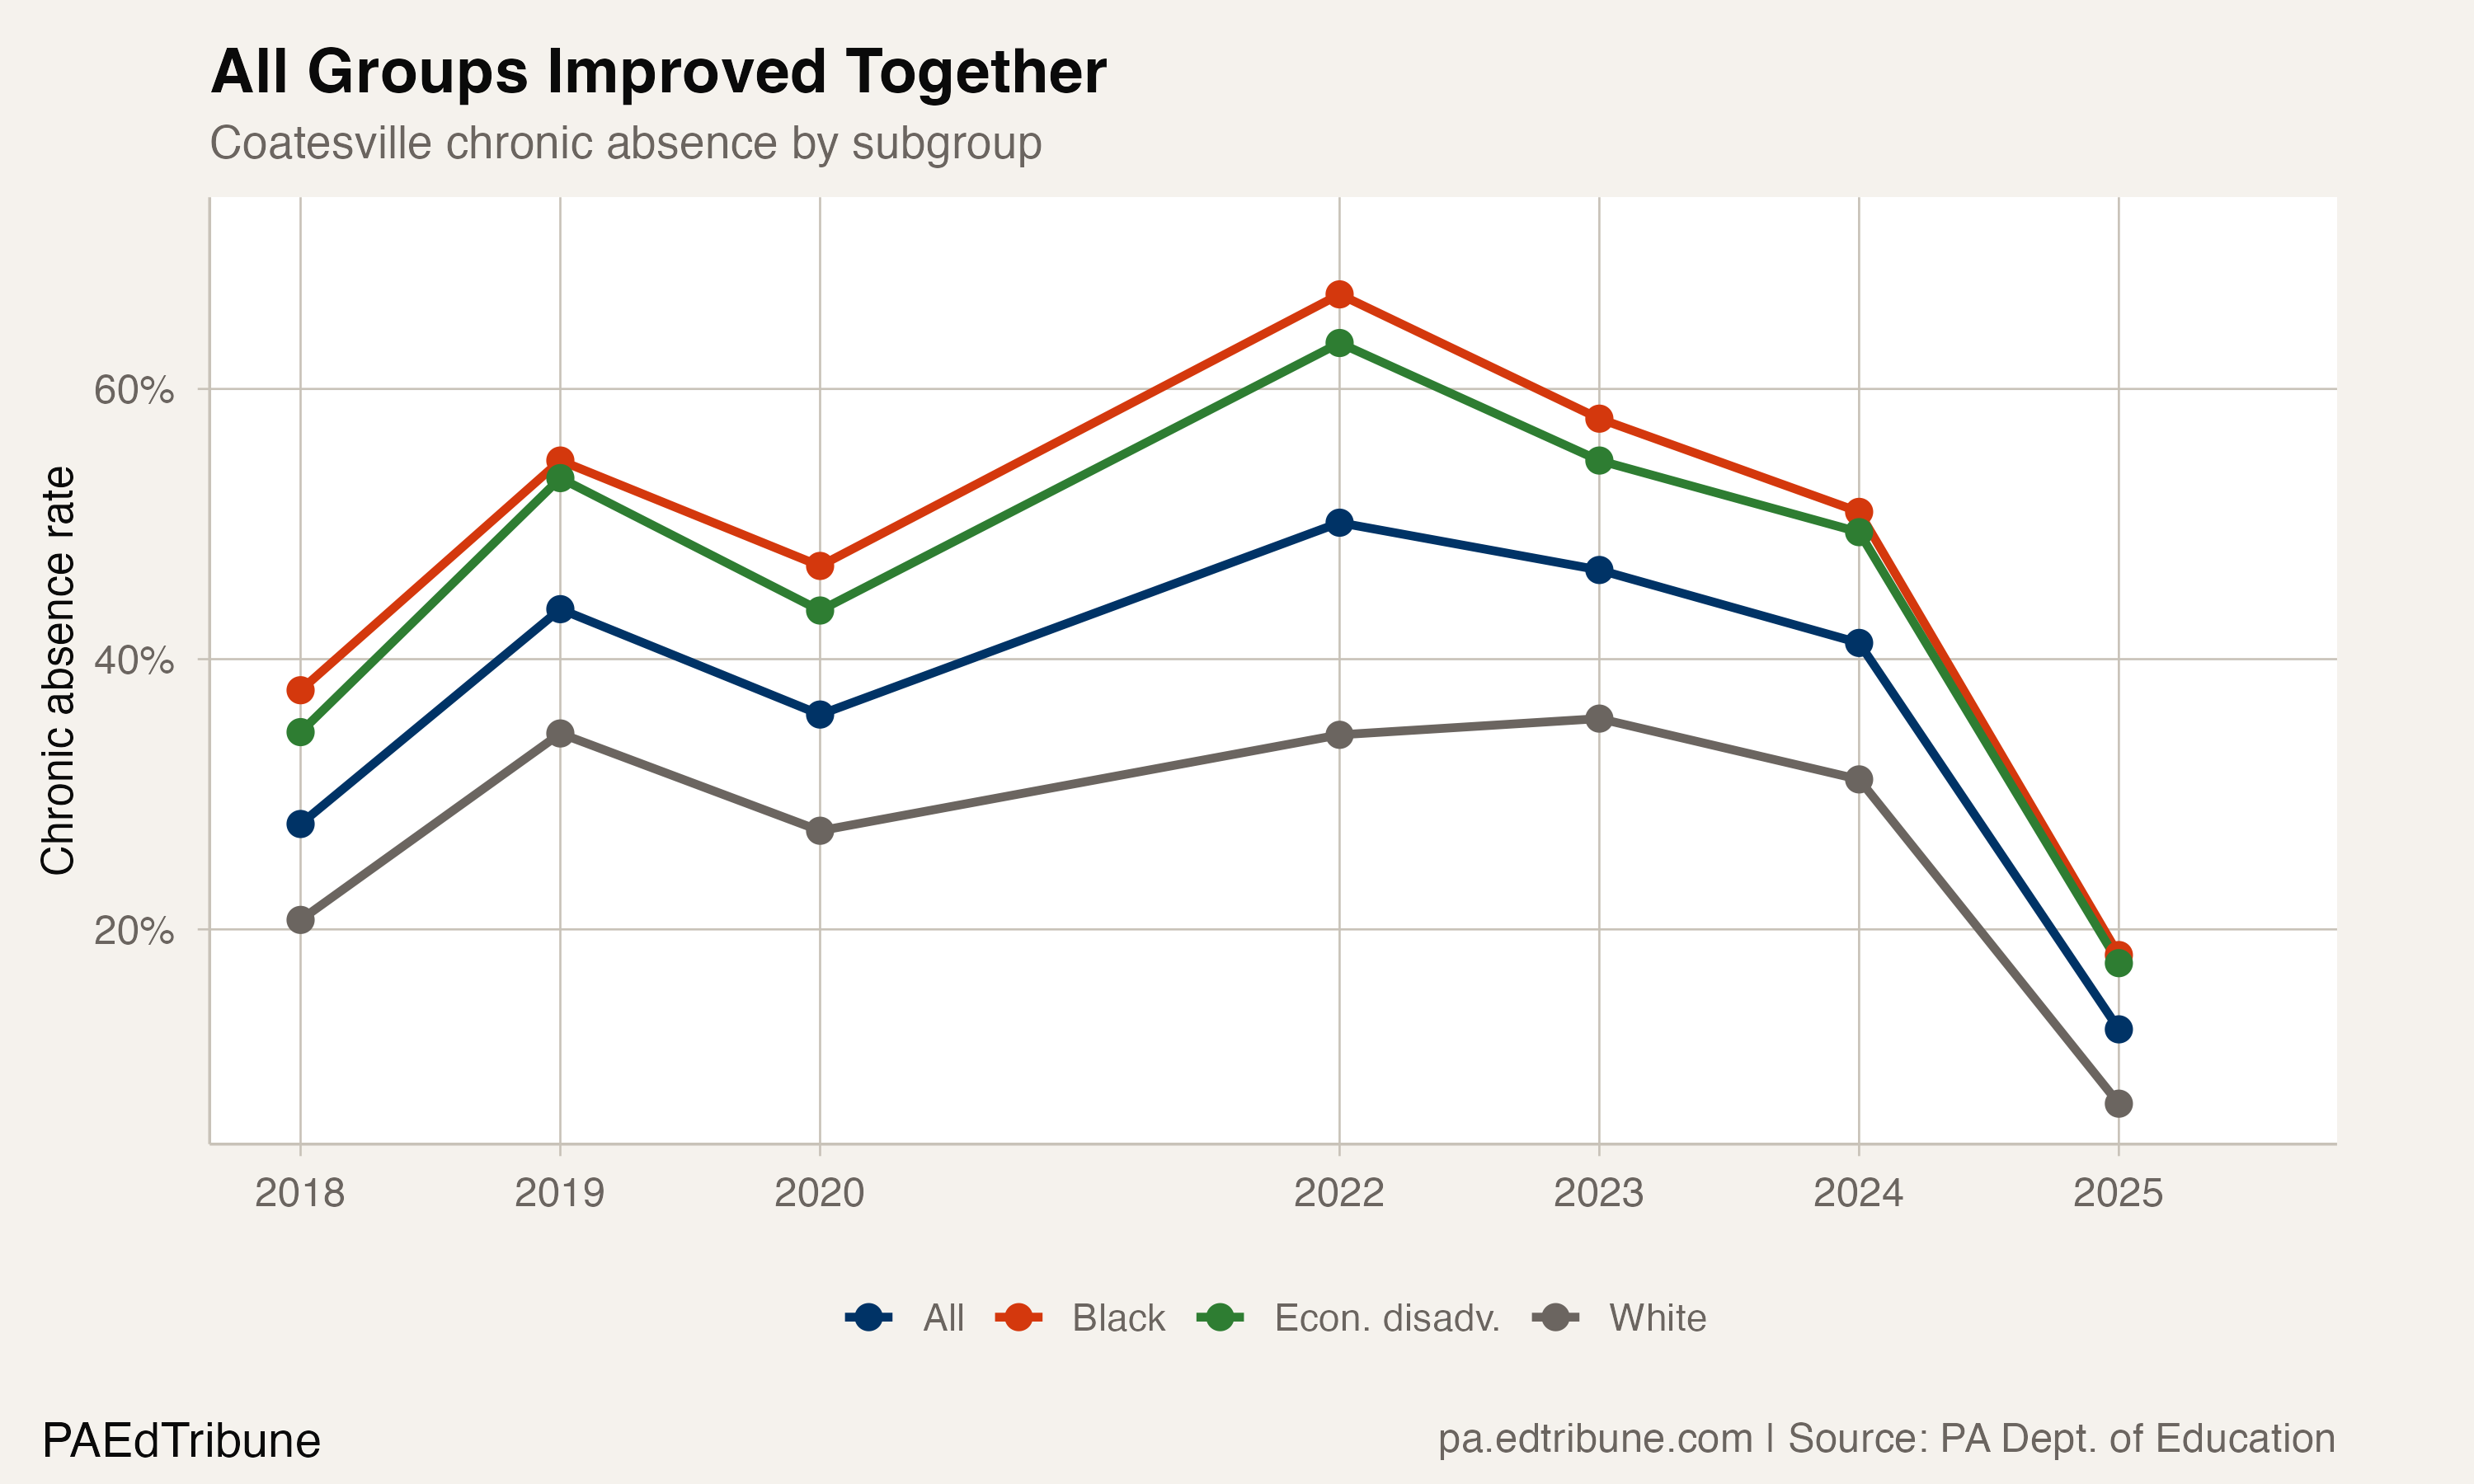
The simultaneous improvement across all student groups is significant. If the change were driven by demographics (wealthier families moving in, lower-income families leaving), the improvement would show up unevenly: white rates would drop while Black and economically disadvantaged rates stayed flat. Instead, every group tracked the same curve downward:
- Black students: 67.0% to 18.1%
- Economically disadvantaged: 63.4% to 17.5%
- Hispanic: 54.9% to 13.6%
- English learners: 60.3% to 12.9%
- White: 34.4% to 7.1%
The parallel decline across all groups suggests a systemic intervention -- something that changed how the district tracks, reports, or addresses attendance across every school at once.
The school count question
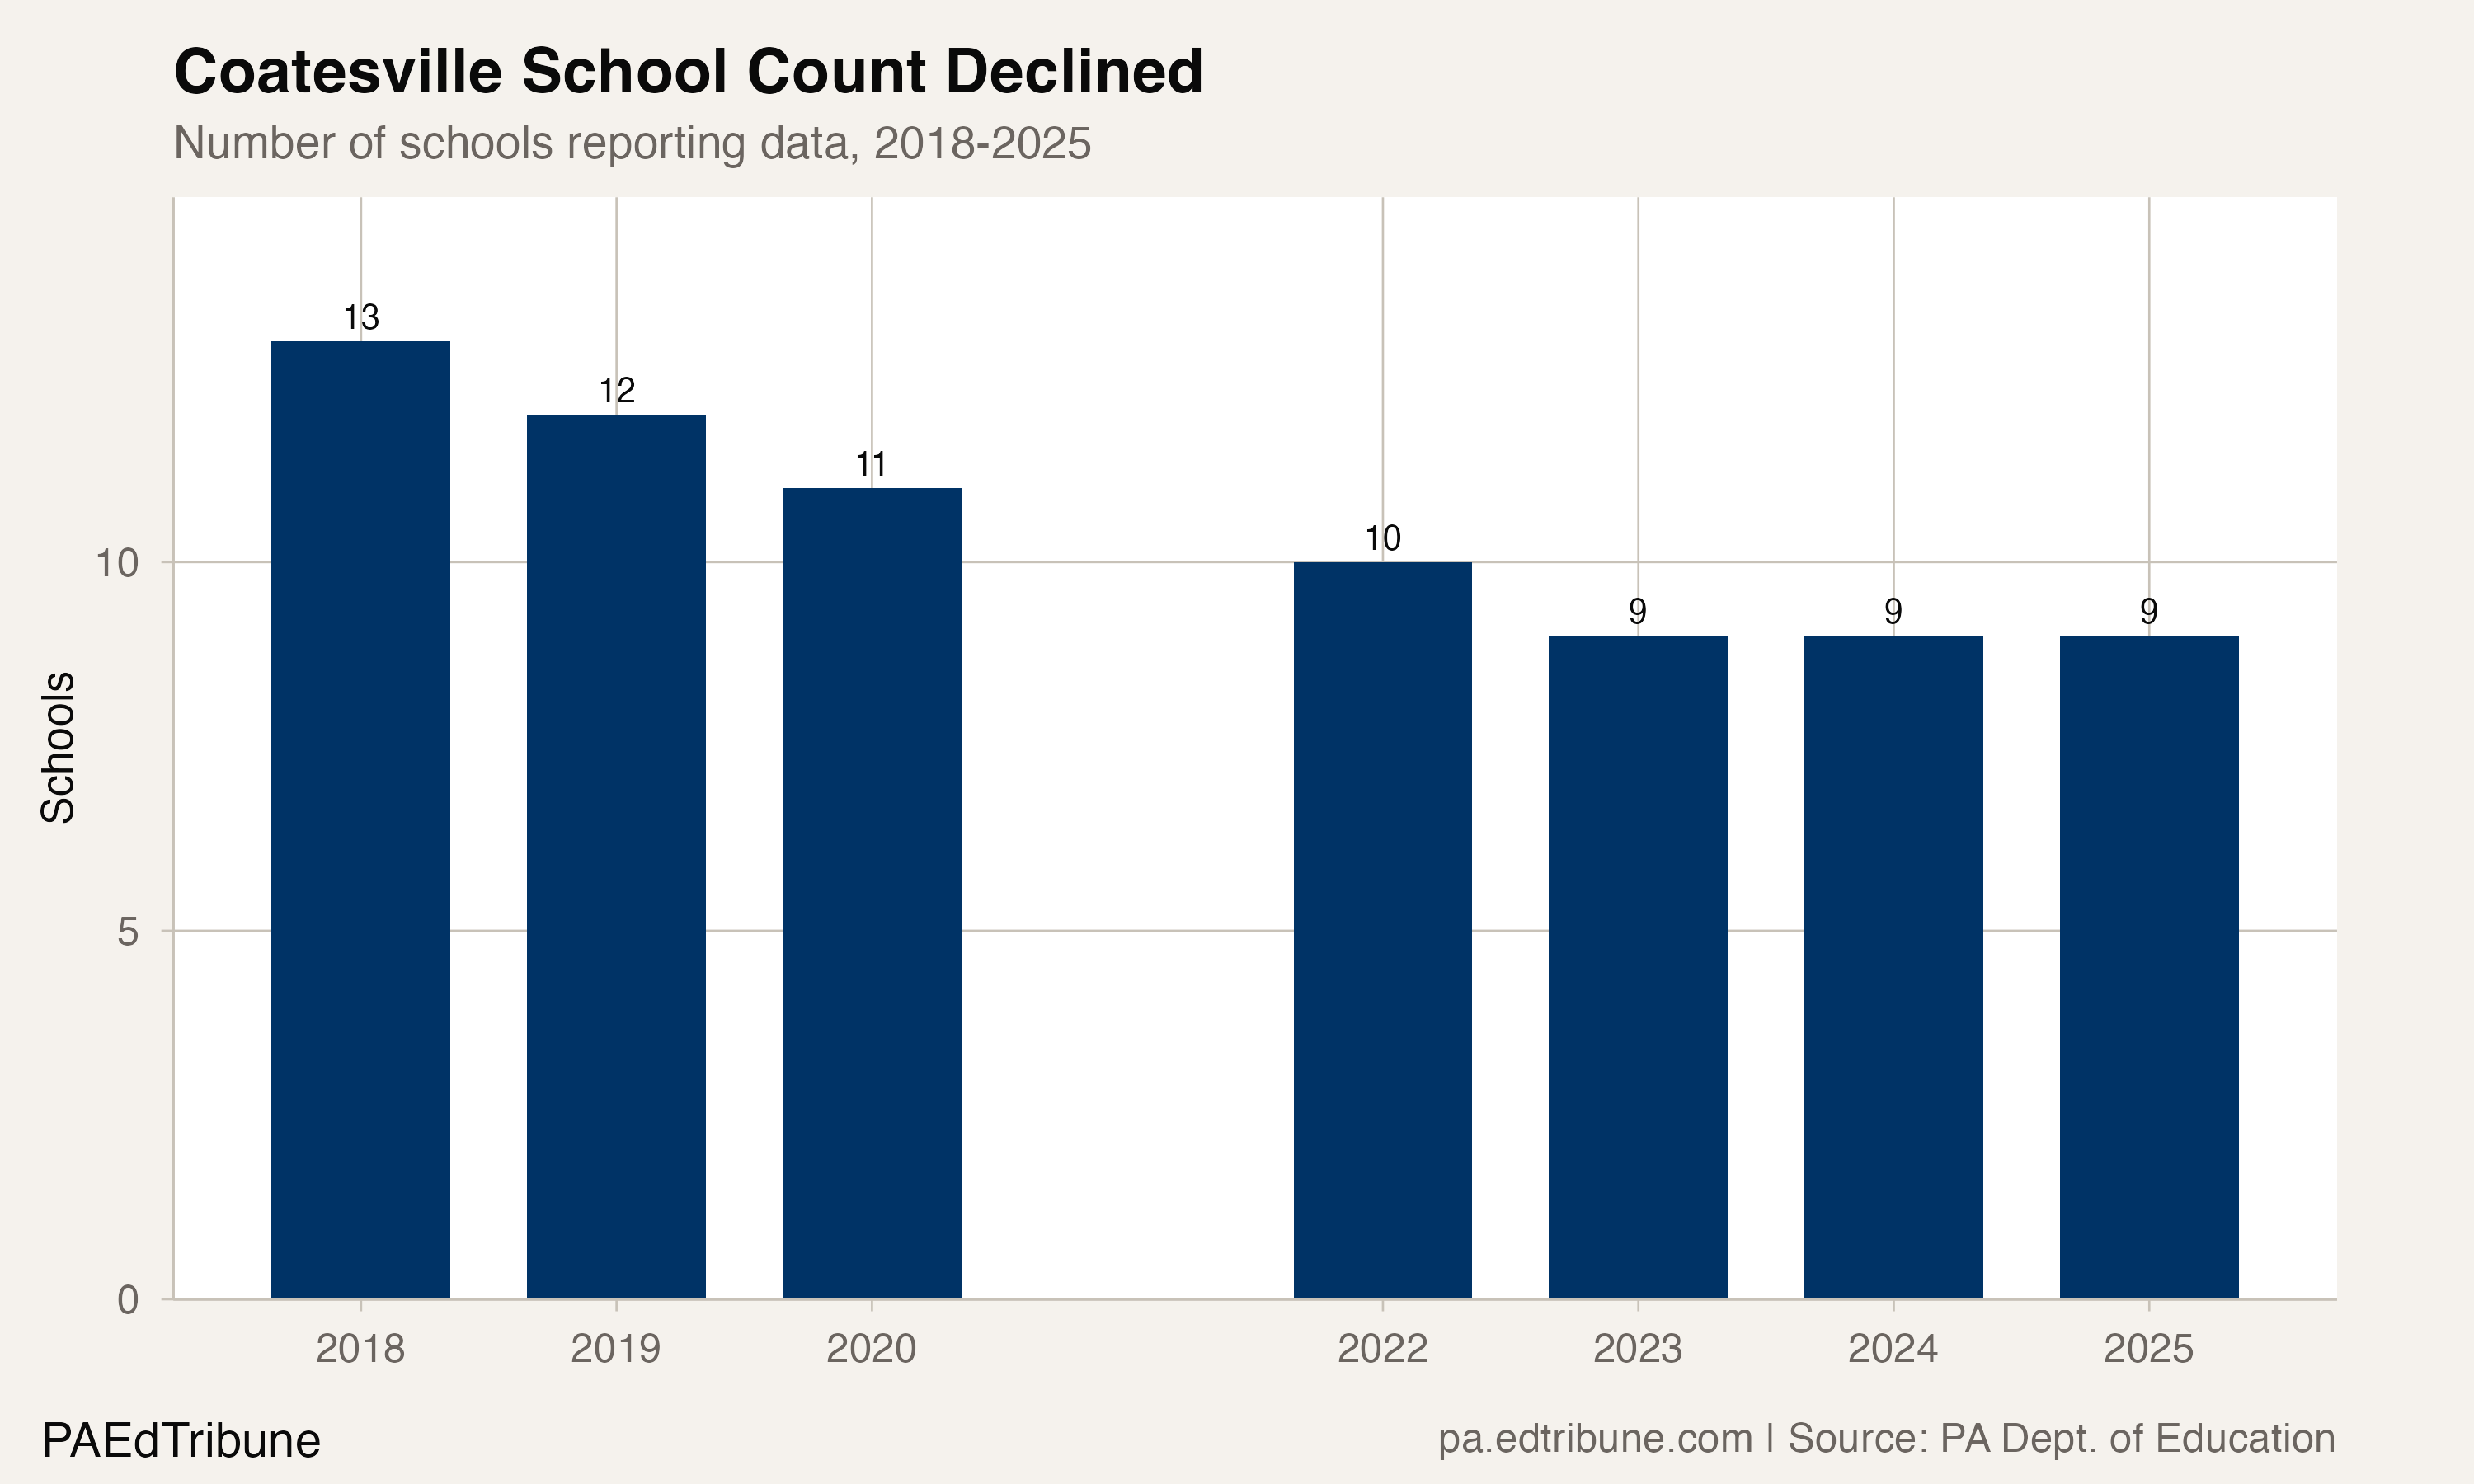
One variable to consider: Coatesville has fewer schools reporting data than it did before COVID. Thirteen schools appeared in the 2018 data. Only nine reported in 2025. The district has announced further reorganization for 2026-27, including two elementary school closures and new middle school feeder patterns.
If the schools that closed or stopped reporting had higher chronic absence rates, their removal from the average would mechanically lower the district rate. However, a 37.5-point drop cannot be explained by the removal of four schools from a 13-school district. The arithmetic does not support it: even if the four removed schools had rates of 100% and the remaining nine had held steady, the mean would have dropped by roughly 15 points, not 37.
What peers didn't do
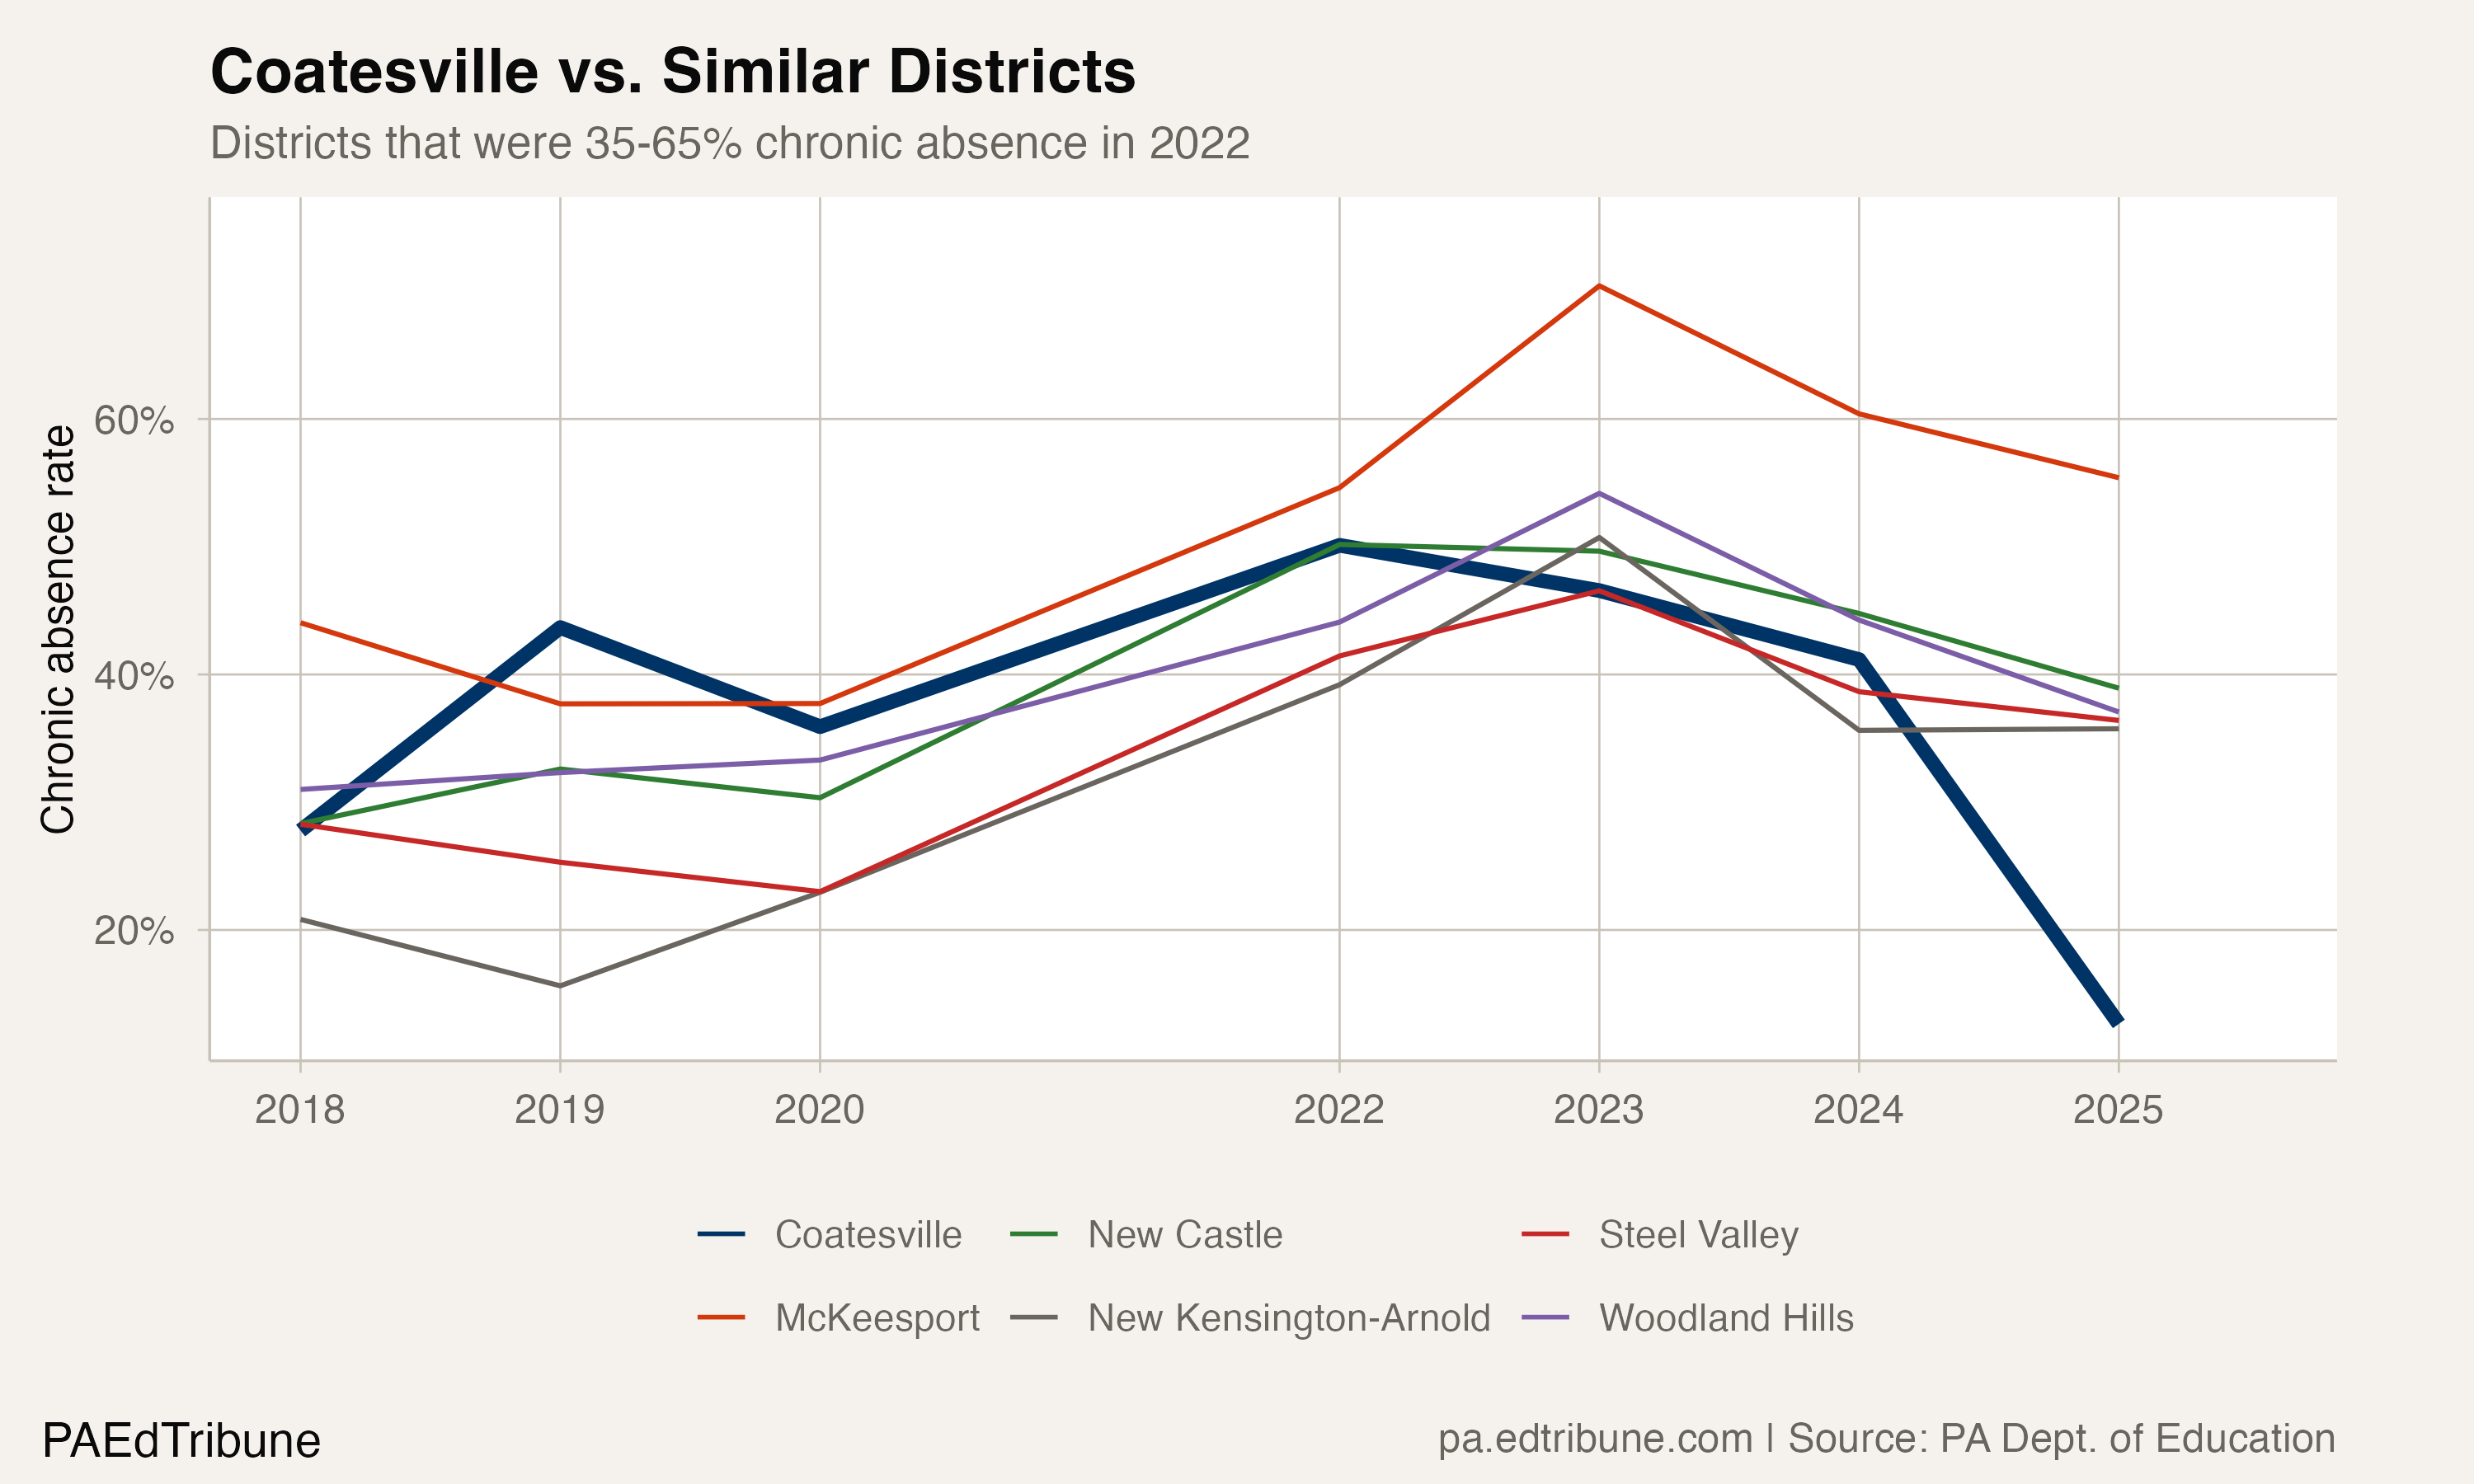
Among traditional districts that had chronic absence rates between 35% and 65% in 2022, Coatesville is the only one to reach the low teens by 2025. The typical trajectory for these high-absence districts shows a modest decline of 5 to 10 points over three years. Coatesville dropped nearly 38.
York City SD↗ET went from a peak of 63.4% in 2023 to 36.8% in 2025, a 26.6-point recovery. That is a genuine success. But Coatesville's numbers represent a fundamentally different kind of change: from one of the worst attendance districts in Pennsylvania to one that is now better than average.
What we do not know
The public record does not contain a clear explanation for Coatesville's attendance transformation. The district's website does not highlight a specific attendance initiative. No local news coverage attributes the change to a named program or policy. The sharp, single-year nature of the improvement (28.6 points in one year) raises the possibility of a reporting or calculation methodology change rather than a behavioral one.
If the improvement reflects real changes in student behavior, Coatesville has done something no other high-absence district in the state has managed. Other superintendents would want to know how. If it reflects a data artifact, it raises questions about how school-level chronic absence rates are calculated and reported statewide. As of early 2026, the district has not publicly explained the change.
Detailed code that reproduces the analysis and figures in this article is available exclusively to EdTribune subscribers.
Discussion
Sign in to join the discussion.
Loading comments...