Before the pandemic, the gap between Black and white chronic absence rates in Philadelphia was 5.2 percentage points. It was a real disparity, but a contained one. By the 2021-22 school year, it had more than tripled to 17.6 points. Three years later, it sits at 15.6, with 42.1% of Black students chronically absent versus 26.5% of white students. The gap did not triple temporarily. It tripled and stayed.
The numbers behind the gap
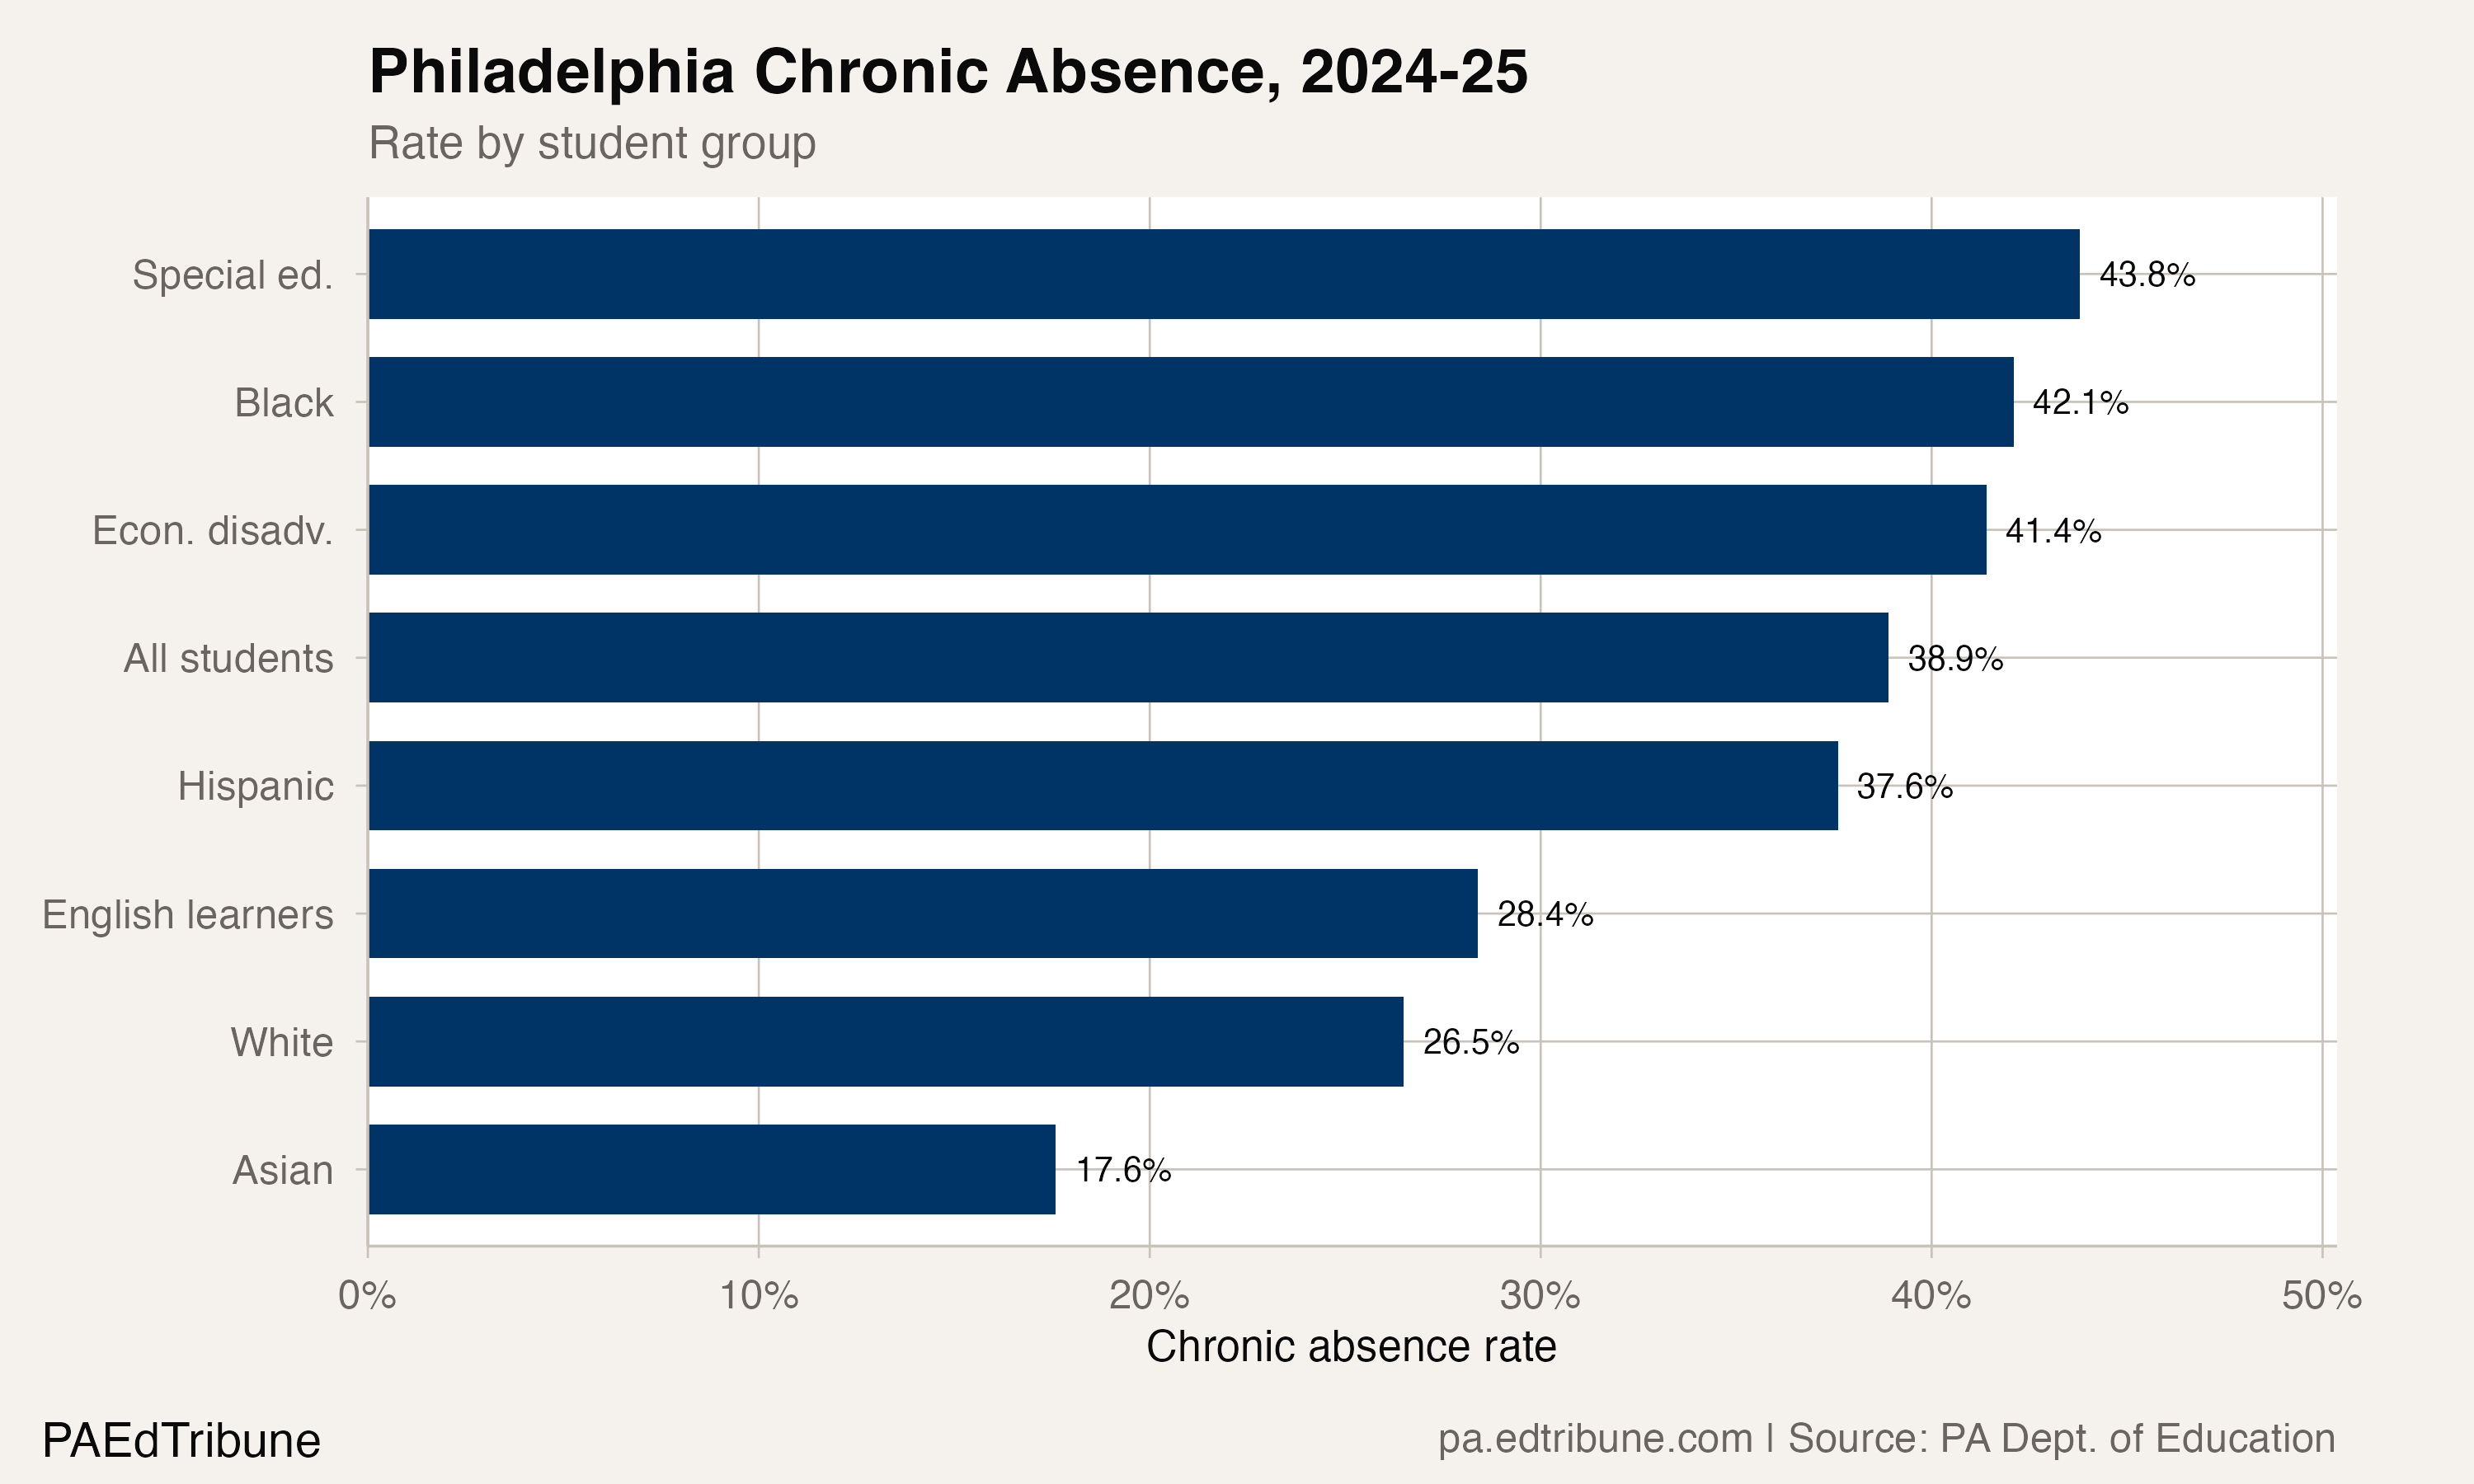
Philadelphia's overall chronic absence rate is 38.9% in 2024-25, nearly double the statewide average of 20.4%. But the aggregate obscures a divergence within. White students in Philadelphia have a chronic absence rate of 26.5%. That is high, and it is 9.5 points above the statewide white rate of 17.0%. Black students, at 42.1%, are 13.2 points above the statewide Black rate of 28.9%.
Hispanic students fall in between at 37.6%, also far above the state average for Hispanic students (24.5%). Asian students, at 17.6%, are the closest to their statewide peers.
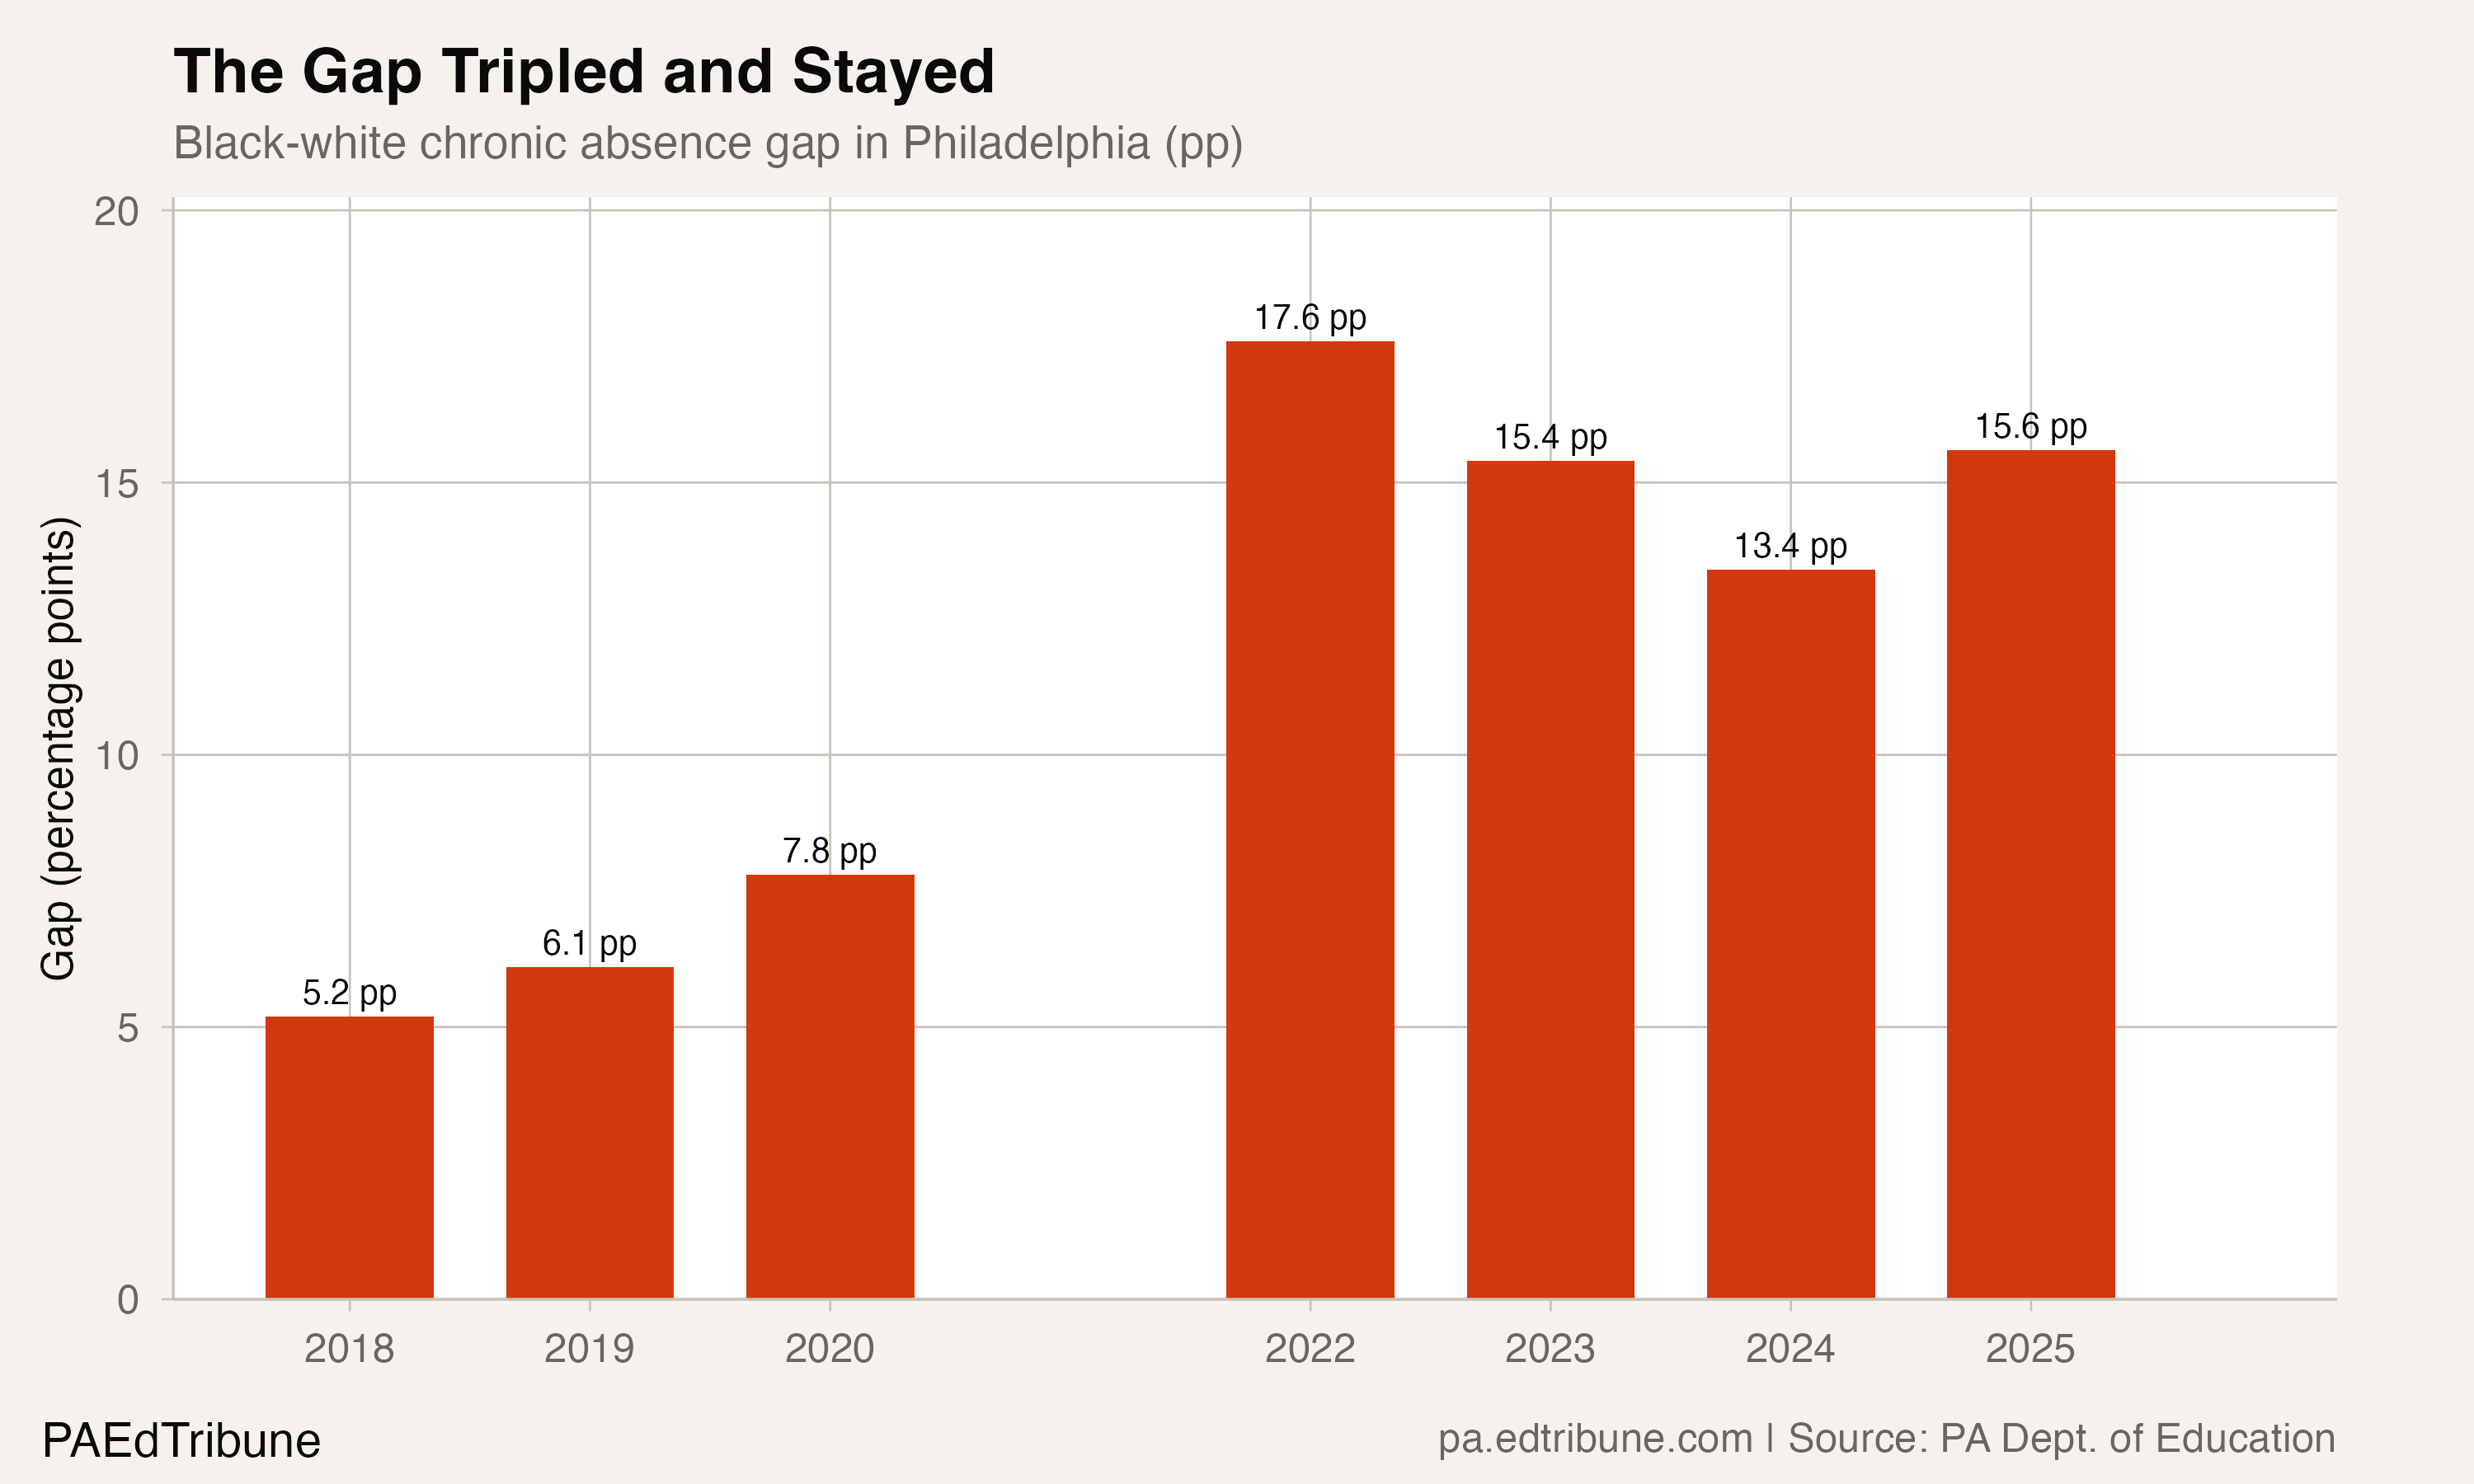
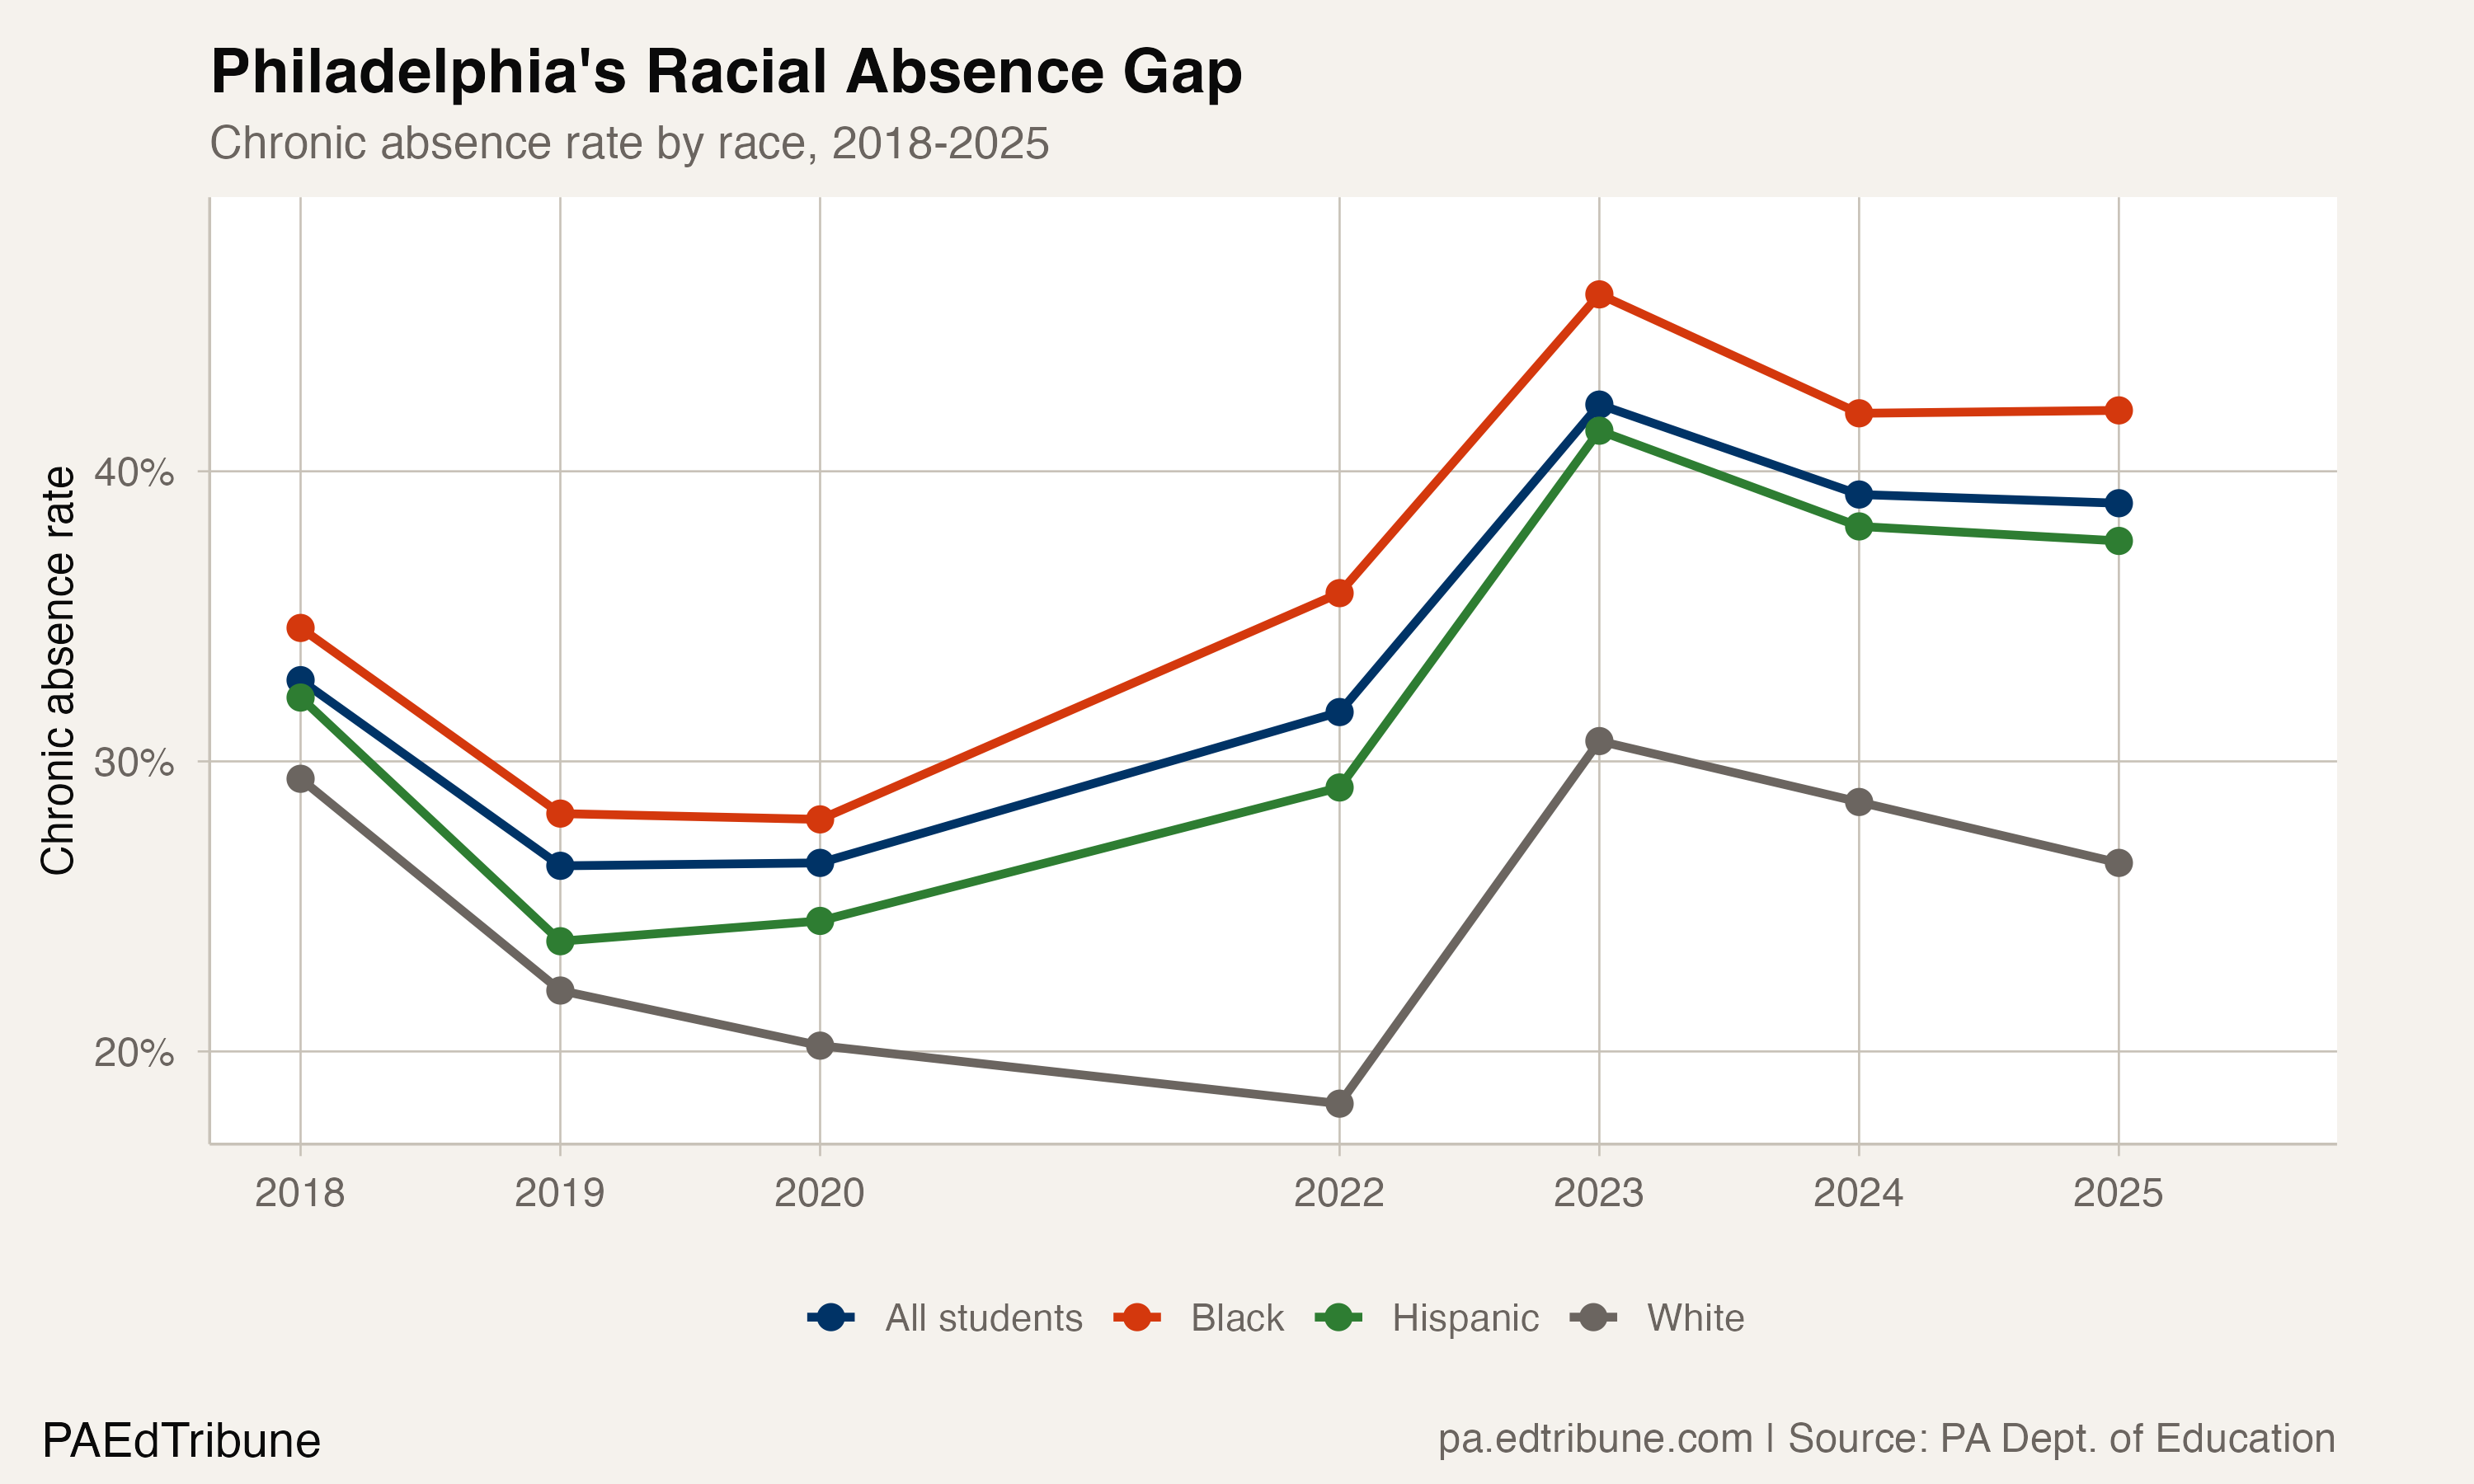
The gap's timeline tells its own story. In 2018, the Black-white difference was 5.2 percentage points. It widened slightly in 2019 (6.1 pp) and 2020 (7.8 pp). Then COVID hit. When schools fully reopened in 2021-22, the gap exploded to 17.6 points. It narrowed to 13.4 in 2023-24, but jumped back to 15.6 in 2024-25. The recovery, such as it is, has not been shared equally.
Two in five, and the structural roots
The Economy League of Greater Philadelphia documented the attendance collapse in a post-pandemic analysis, finding that Black students' chronic absenteeism rose by 20 percentage points between 2018-19 and 2021-22, from 19% to 39%. Hispanic students saw a 21-point increase. White and Asian students experienced smaller increases.
What makes Philadelphia's gap structural rather than temporary: the district's white rate of 26.5% is itself well above the statewide average. This is not a story of one group doing well and another doing poorly. Both groups are in crisis. The gap exists because Black students face additional barriers that compound the ones affecting all Philadelphia students: transportation instability, housing disruption, exposure to community violence, and the cascading effects of poverty on school engagement.
Economically disadvantaged students in Philadelphia have a rate of 41.4%, nearly identical to the Black rate, reflecting the heavy overlap between racial and economic disadvantage in the district.
Philadelphia against the state
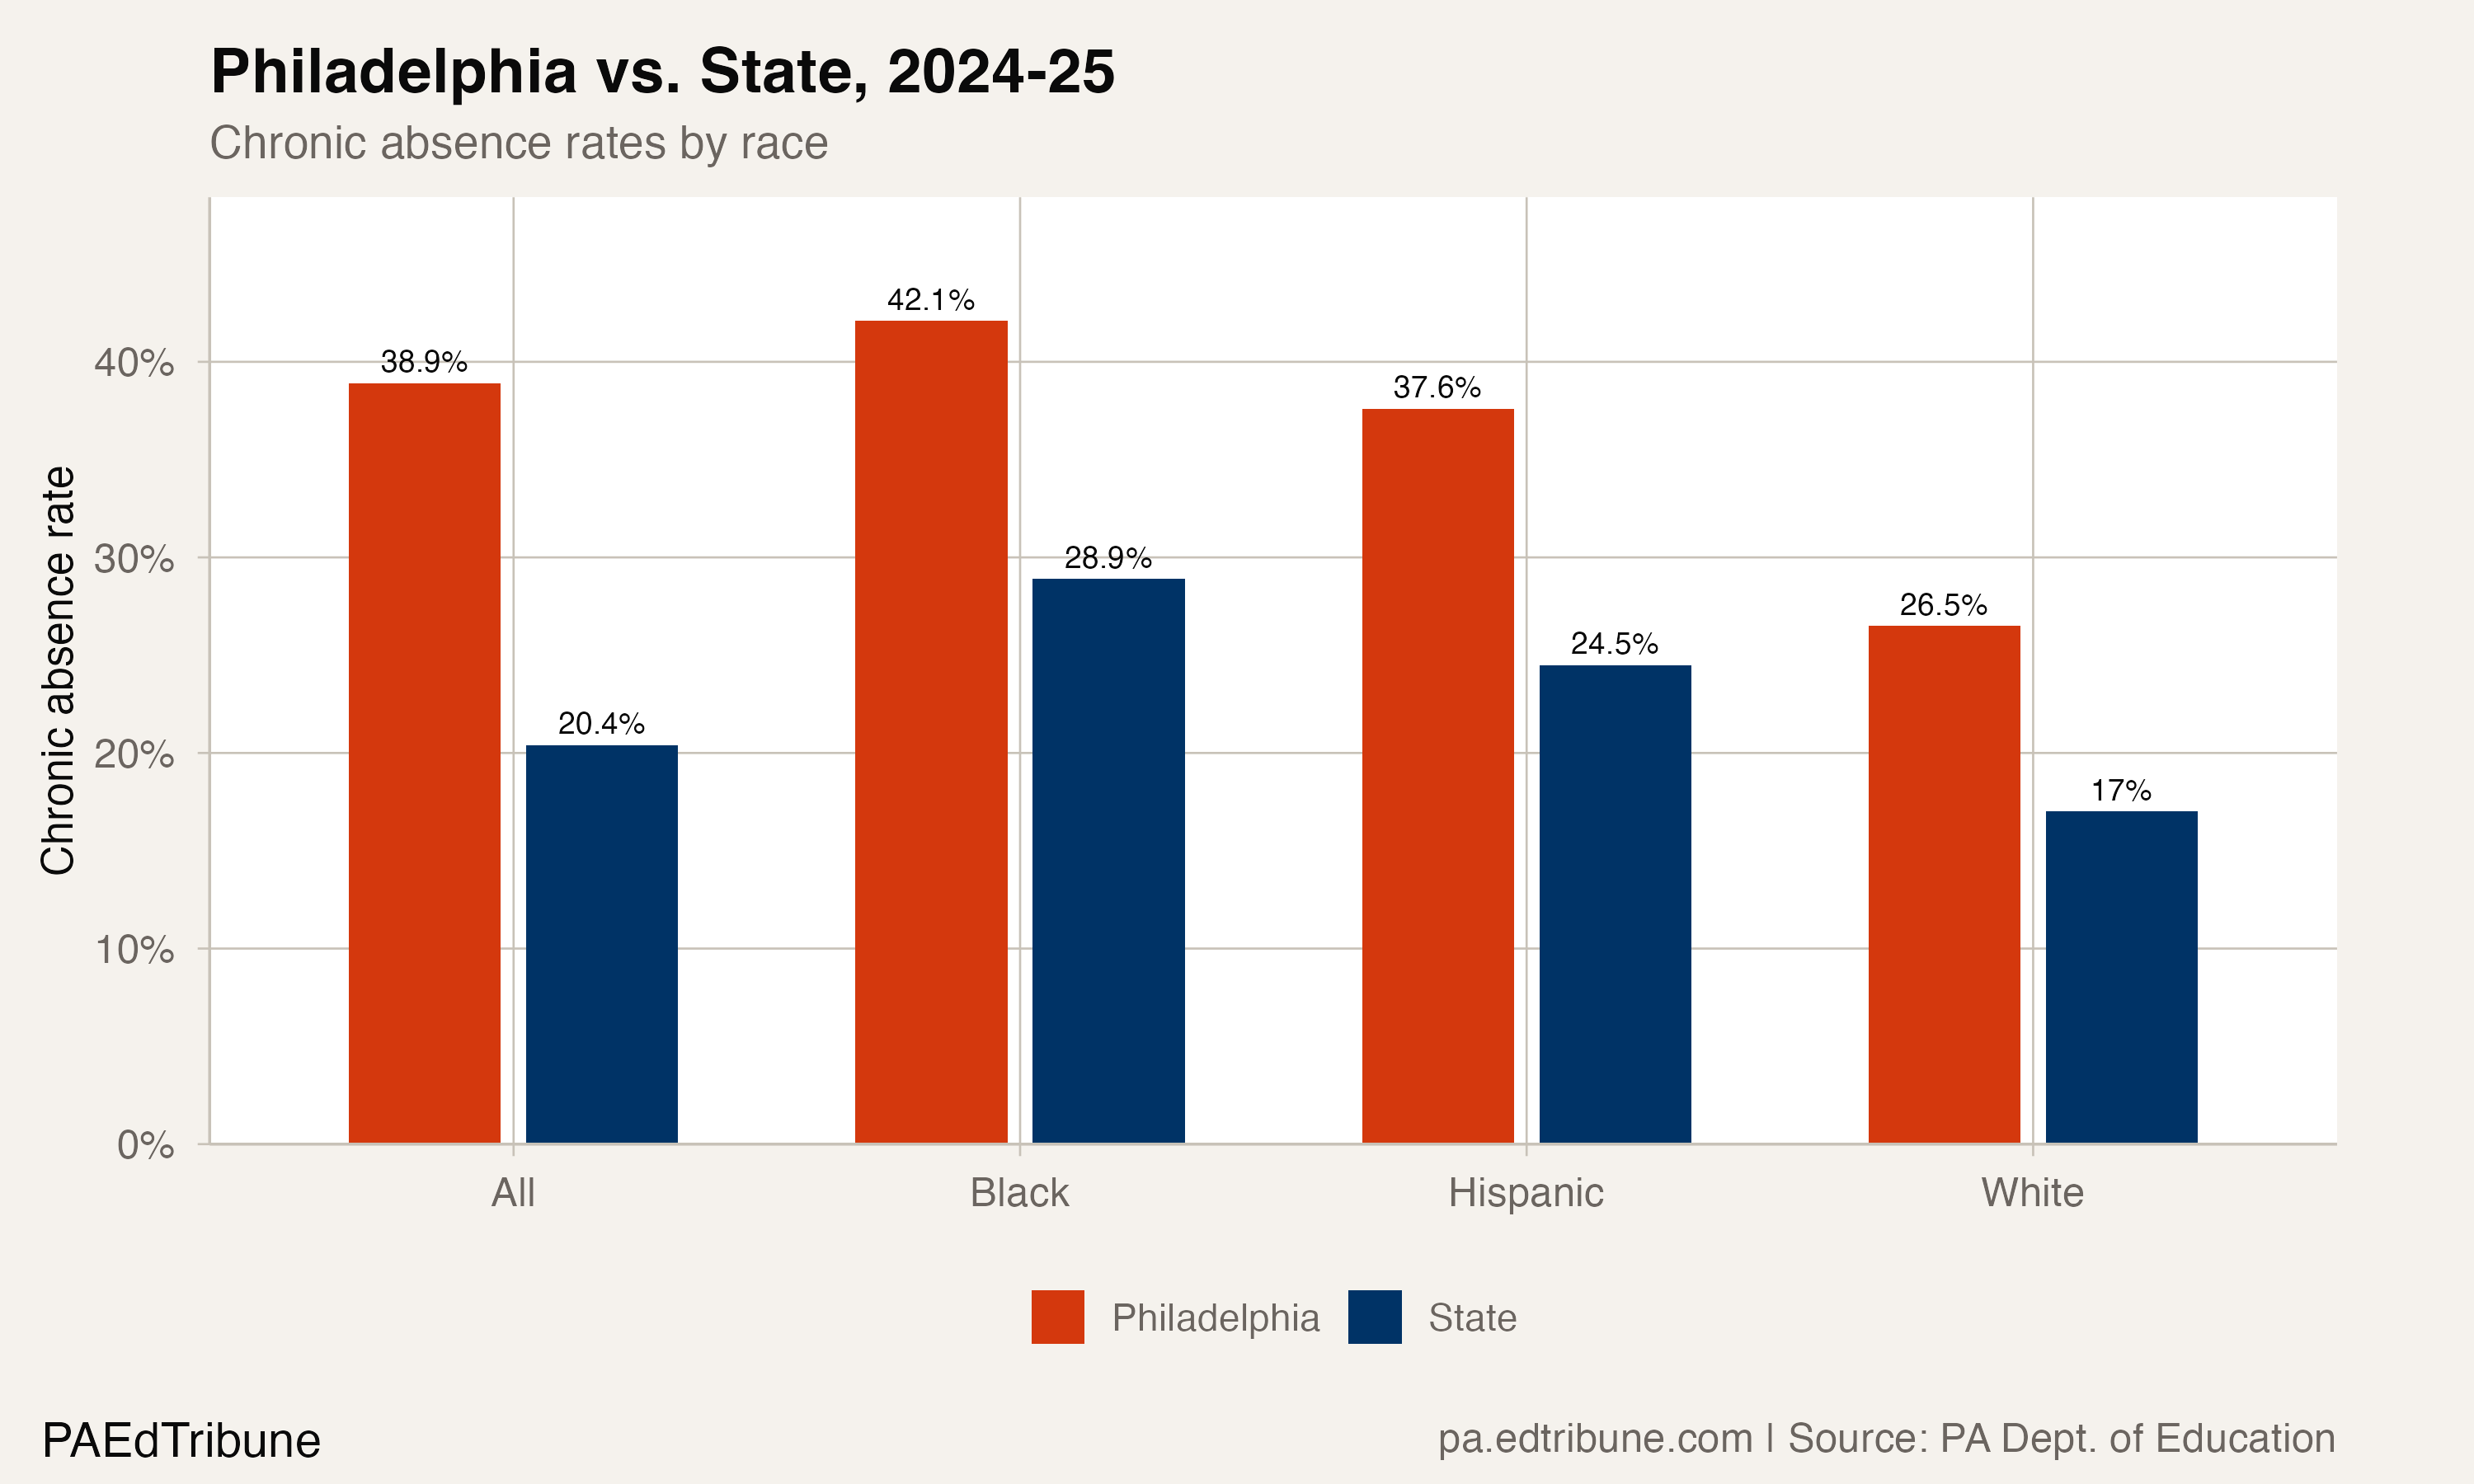
The comparison with statewide rates reveals the scale of Philadelphia's challenge. The district's overall rate of 38.9% is nearly double the state's 20.4%. For Black students, the gap is 13.2 points (42.1% vs. 28.9%). For white students, it is 9.5 points (26.5% vs. 17.0%).
This means the equity gap within Philadelphia (15.6 pp) is larger than the already-widened statewide Black-white gap (11.9 pp). The district has both a higher baseline for all groups and a wider disparity between them.
The one group that closed its gap
English learner students in Philadelphia have a chronic absence rate of 28.4%, well below the district average of 38.9%. This matches a statewide pattern: English learners are the only subgroup whose chronic absence gap has fully closed, falling from 1.0 percentage point above the state average to exactly matching it.
In Philadelphia, the English learner rate actually decreased from 2023 to 2025, moving from 32.5% to 28.4%, a larger improvement than the district as a whole. Language support programs and community engagement with immigrant families may be producing attendance benefits that other intervention strategies have not matched, though Philadelphia has not publicly attributed this improvement to specific programs.
What narrowing would actually require
The Black-white gap in Philadelphia was 5.2 points in 2018. Getting back to that level would require either a 10-point drop in the Black rate (from 42.1% to roughly 32%) or a convergence from both sides. Neither trend is visible in the current data. The gap shrank from 17.6 to 13.4 between 2022 and 2024, then widened back to 15.6 in 2025.
National research has found that the students who experienced the largest pandemic-era attendance increases are the furthest from their pre-pandemic levels, and that in many states, the gaps between these students and their peers have widened rather than narrowed. Philadelphia fits this pattern precisely. The gap exists. Three years of recovery have failed to narrow it. No program operating in the district has demonstrated results at the scale the data demands.
Detailed code that reproduces the analysis and figures in this article is available exclusively to EdTribune subscribers.
Discussion
Sign in to join the discussion.
Loading comments...