In 2011, roughly two out of three Black students in Pennsylvania graduated from high school in four years. By 2024, four out of five did.
That 15.2 percentage point improvement (from 65.3% to 80.5%) outpaced every other racial subgroup in the commonwealth and cut the white-Black graduation gap nearly in half. The gap dropped from 22.9 percentage points to 11.1, a 51.5% reduction over 13 years.
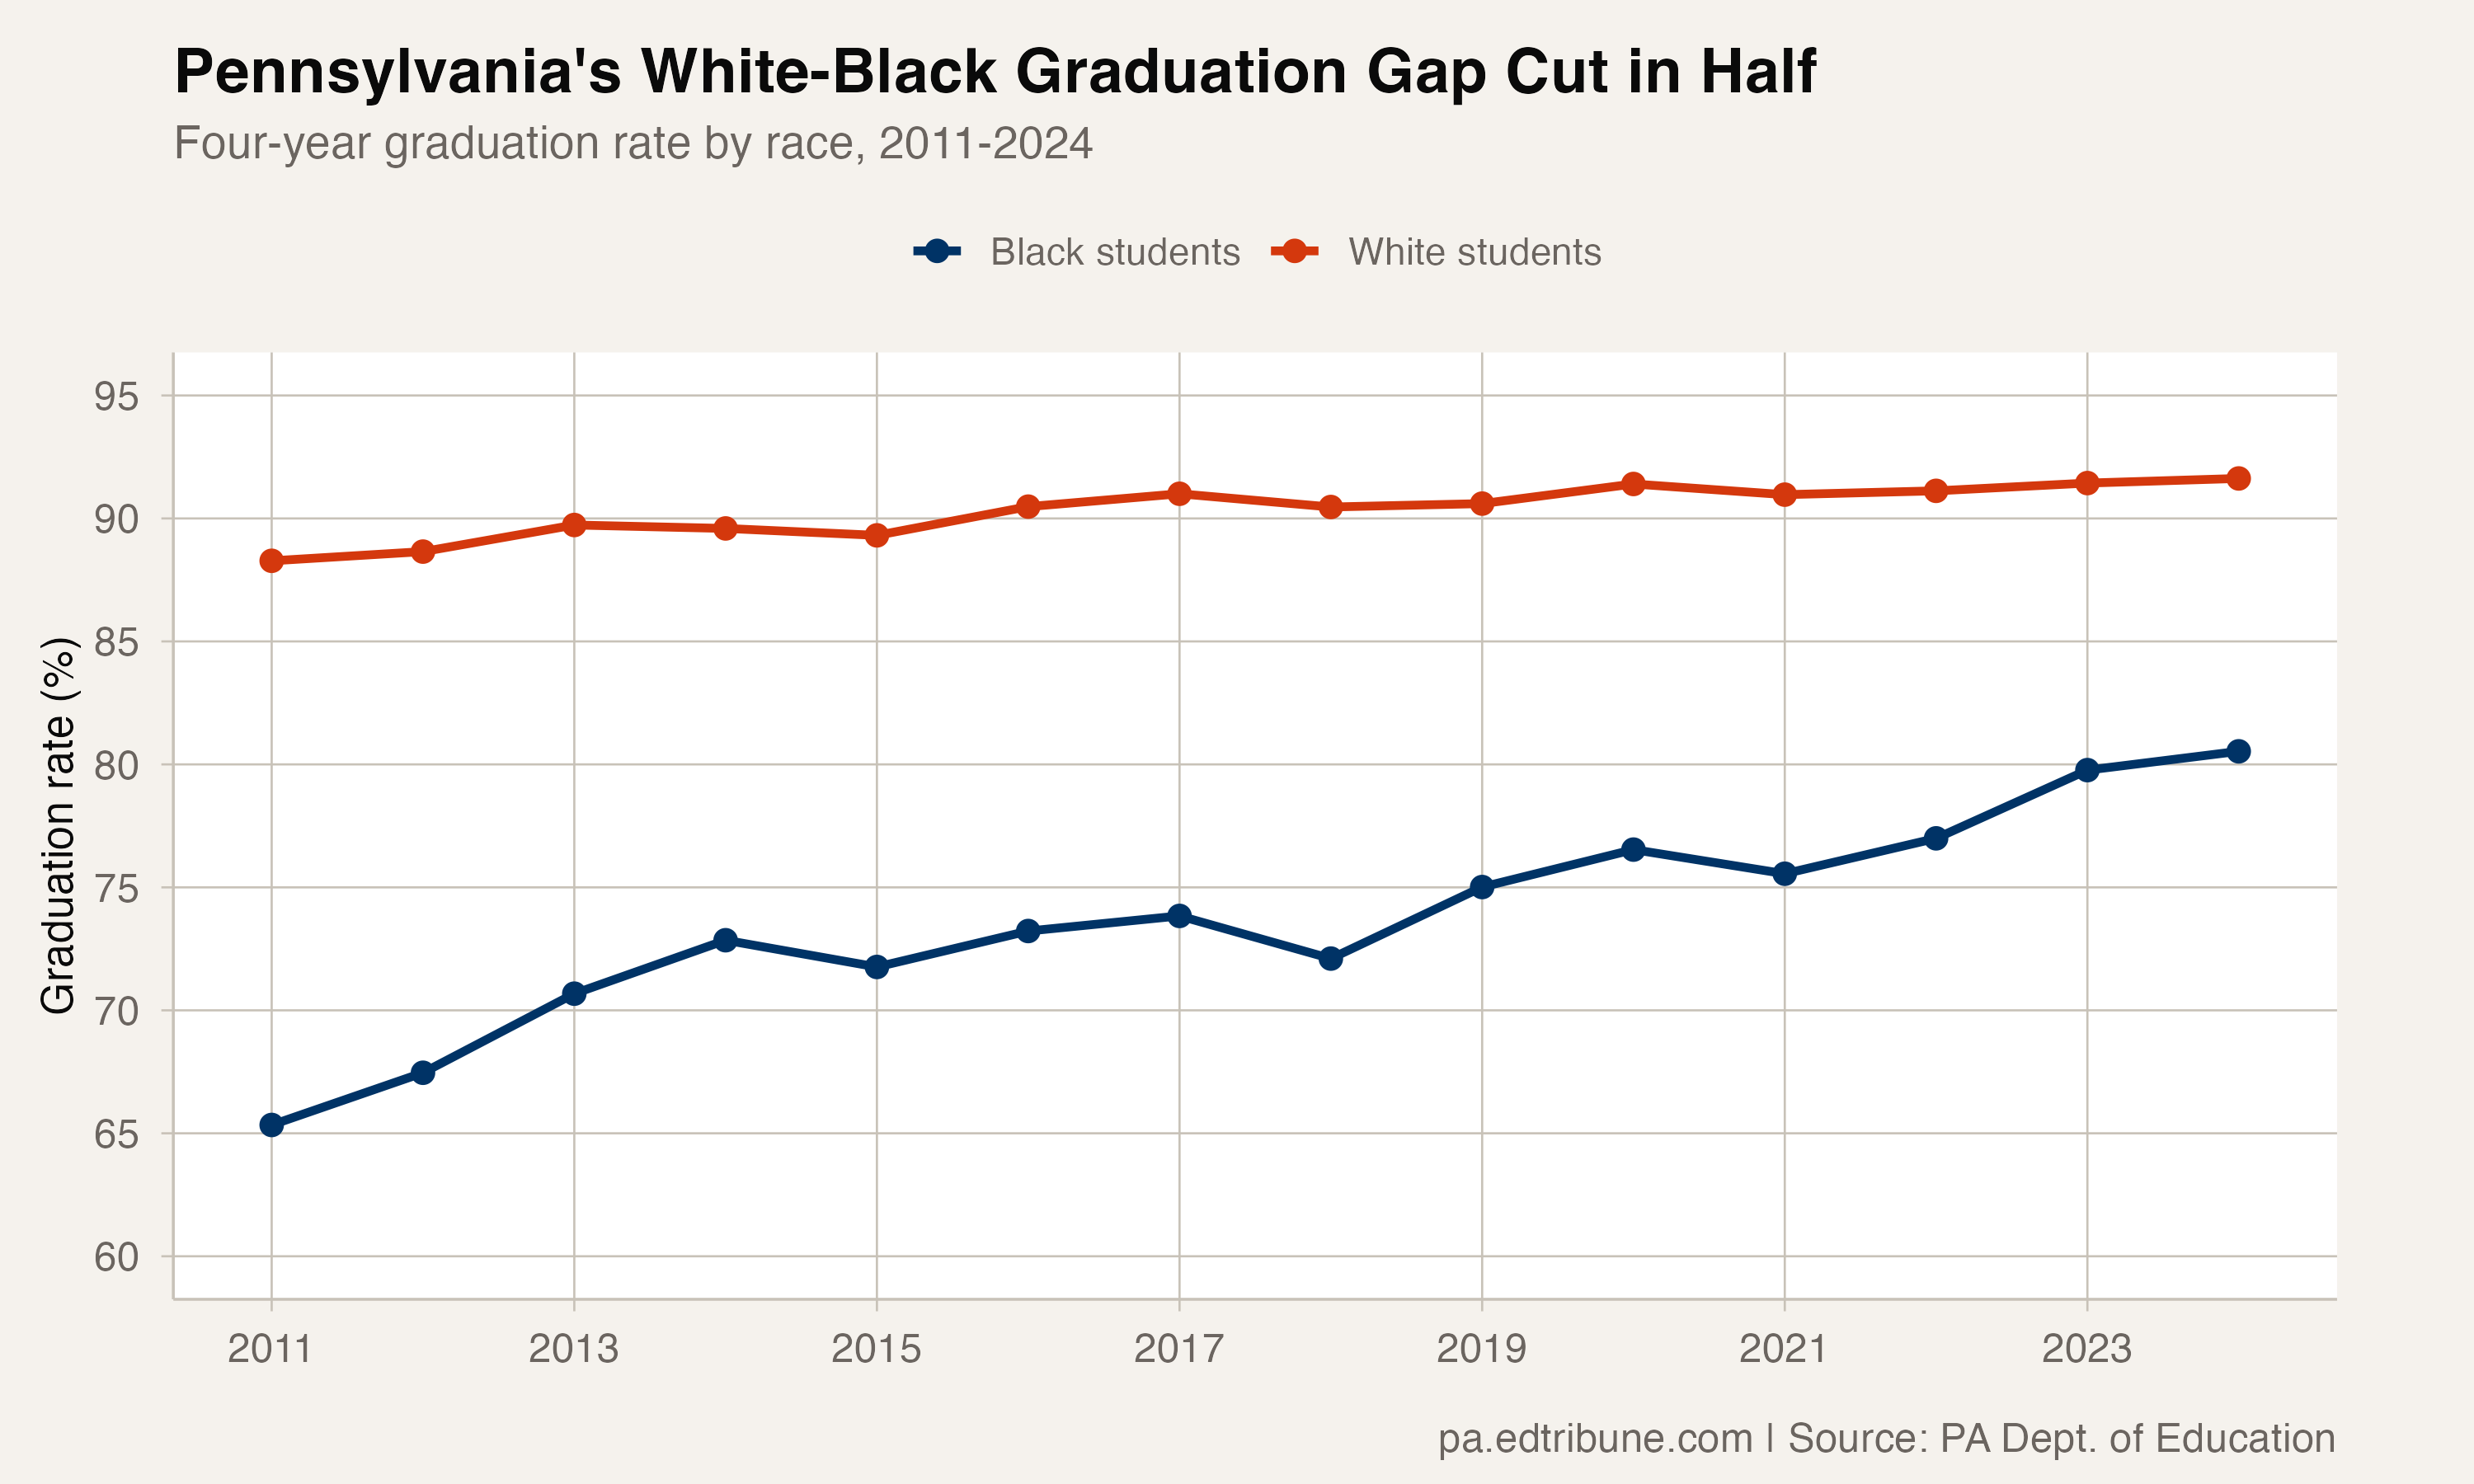
The improvement is real and broad-based. It happened in Philadelphia and Pittsburgh, in suburban ring districts, and in mid-size cities across the state. It accelerated after 2019. Black graduation rates gained 5.5 percentage points in the five most recent years while white rates gained just 1.0, suggesting the closing is driven by genuine uplift rather than statistical noise.
It also happened in a state ranked 49th nationally in Black-white education opportunity gaps, according to a 2022 Chalkbeat analysis. By nearly every measure other than graduation (access to gifted programs, AP enrollment, school funding equity, discipline rates), Pennsylvania's racial disparities remain among the worst in the country. The graduation gap is closing even as those broader inequities persist, raising the question of whether the diploma has become a better indicator of progress or simply an easier bar to clear.
The acceleration
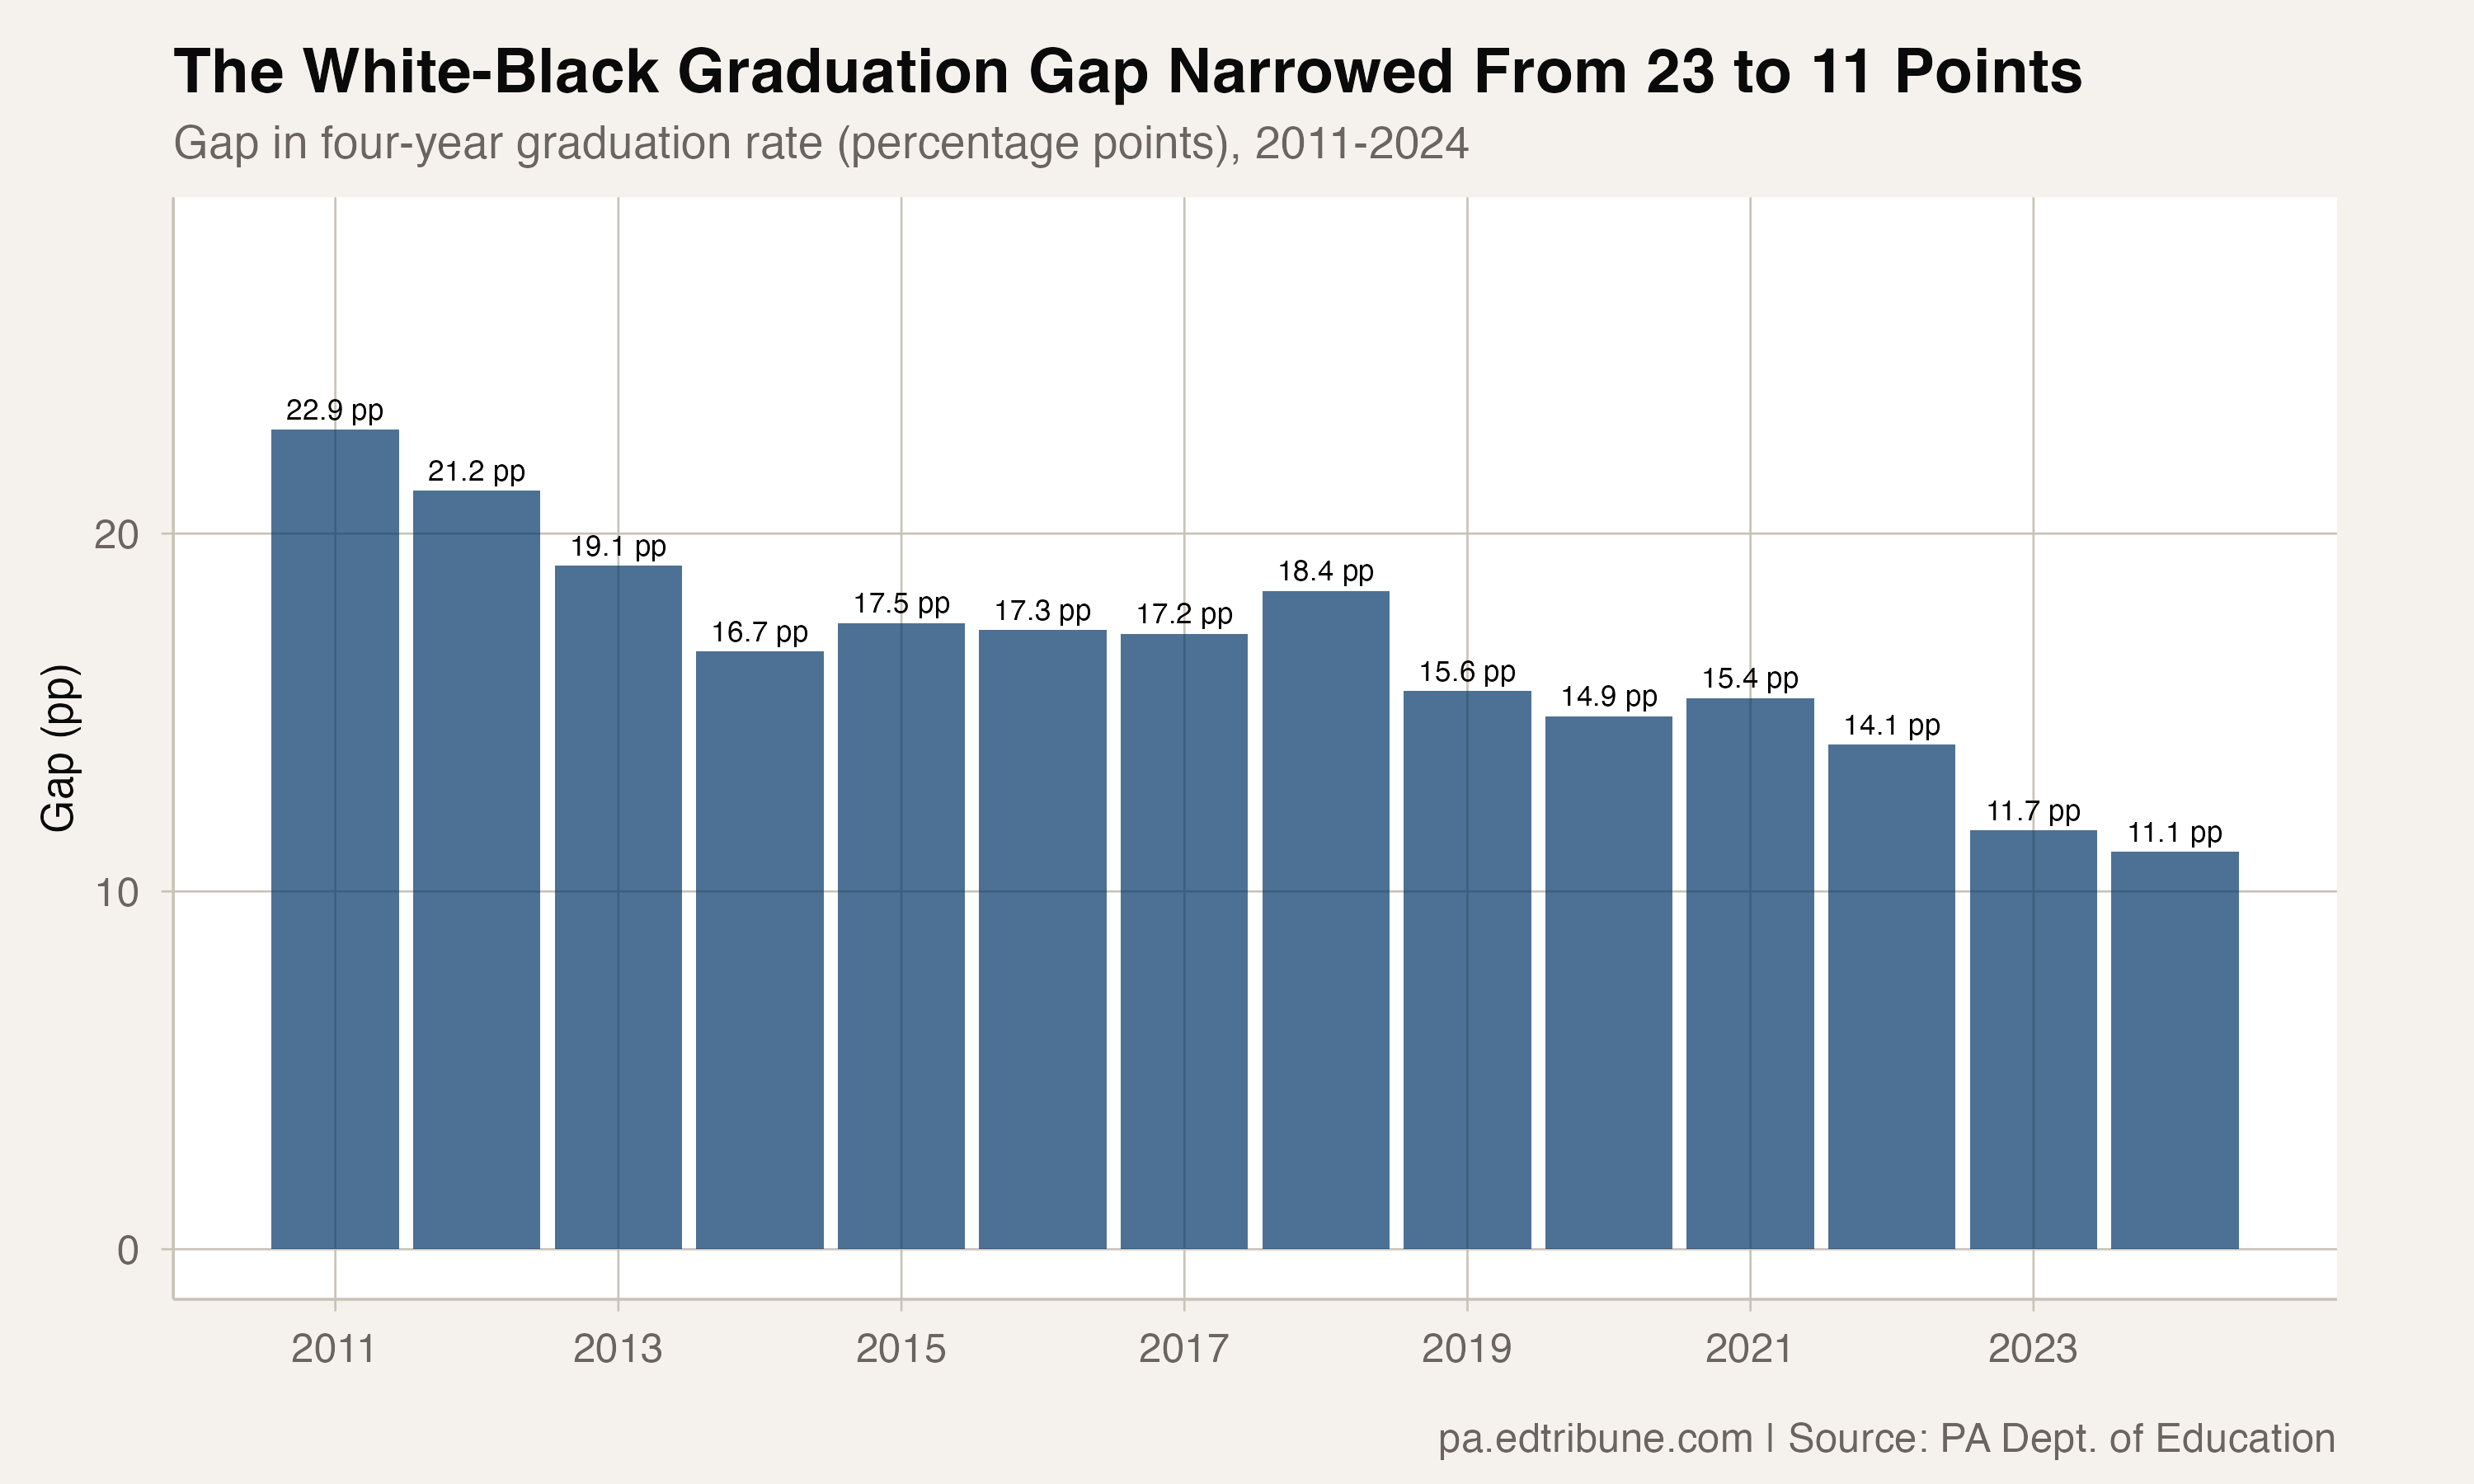
The gap narrowed in three distinct phases.
From 2011 to 2014, Black graduation rates jumped 7.6 percentage points in just three years — the steepest improvement of the entire period. This coincided with national momentum around graduation rate accountability. The gap fell from 22.9 to 16.7 points.
From 2015 to 2019, progress slowed and became uneven. Black rates dipped in 2015 and 2018 before recovering. By 2019, the gap sat at 15.6 points. Modest progress in five years.
From 2019 to 2024, the gap narrowed faster than in the preceding five years. Black rates climbed from 75.0% to 80.5% while white rates inched from 90.6% to 91.6%. The convergence happened despite COVID, despite learning loss, despite the disruptions that widened achievement gaps on standardized tests. Whatever forces are driving graduation rate improvement continued to operate through the pandemic.
Where the gains came from
Philadelphia accounts for a disproportionate share. The city's Black graduation rate rose from 56.5% in 2011 to 75.3% in 2024, an 18.8 point gain. Philadelphia's 9th Grade Success Network, which expanded to 24 schools and specifically targets Black and Latino young men, is credited with much of the district's overall 21.1 point improvement. The program's architects report that 9th-grade on-track rates for Black young men increased 13.4 percentage points between 2018-19 and 2023-24.
Pittsburgh's Black graduation rate improved substantially as well. The district halved its student-to-counselor ratio from 699:1 to 350:1, an investment its leaders credit for graduation gains that exceeded pre-pandemic targets.
But the improvement was not limited to the two largest cities. Statewide, the Black graduation rate crossed 80% for the first time in 2024 — a milestone that means Black students in Pennsylvania now graduate at a rate higher than the overall state rate was in 2011.
The gap that remains
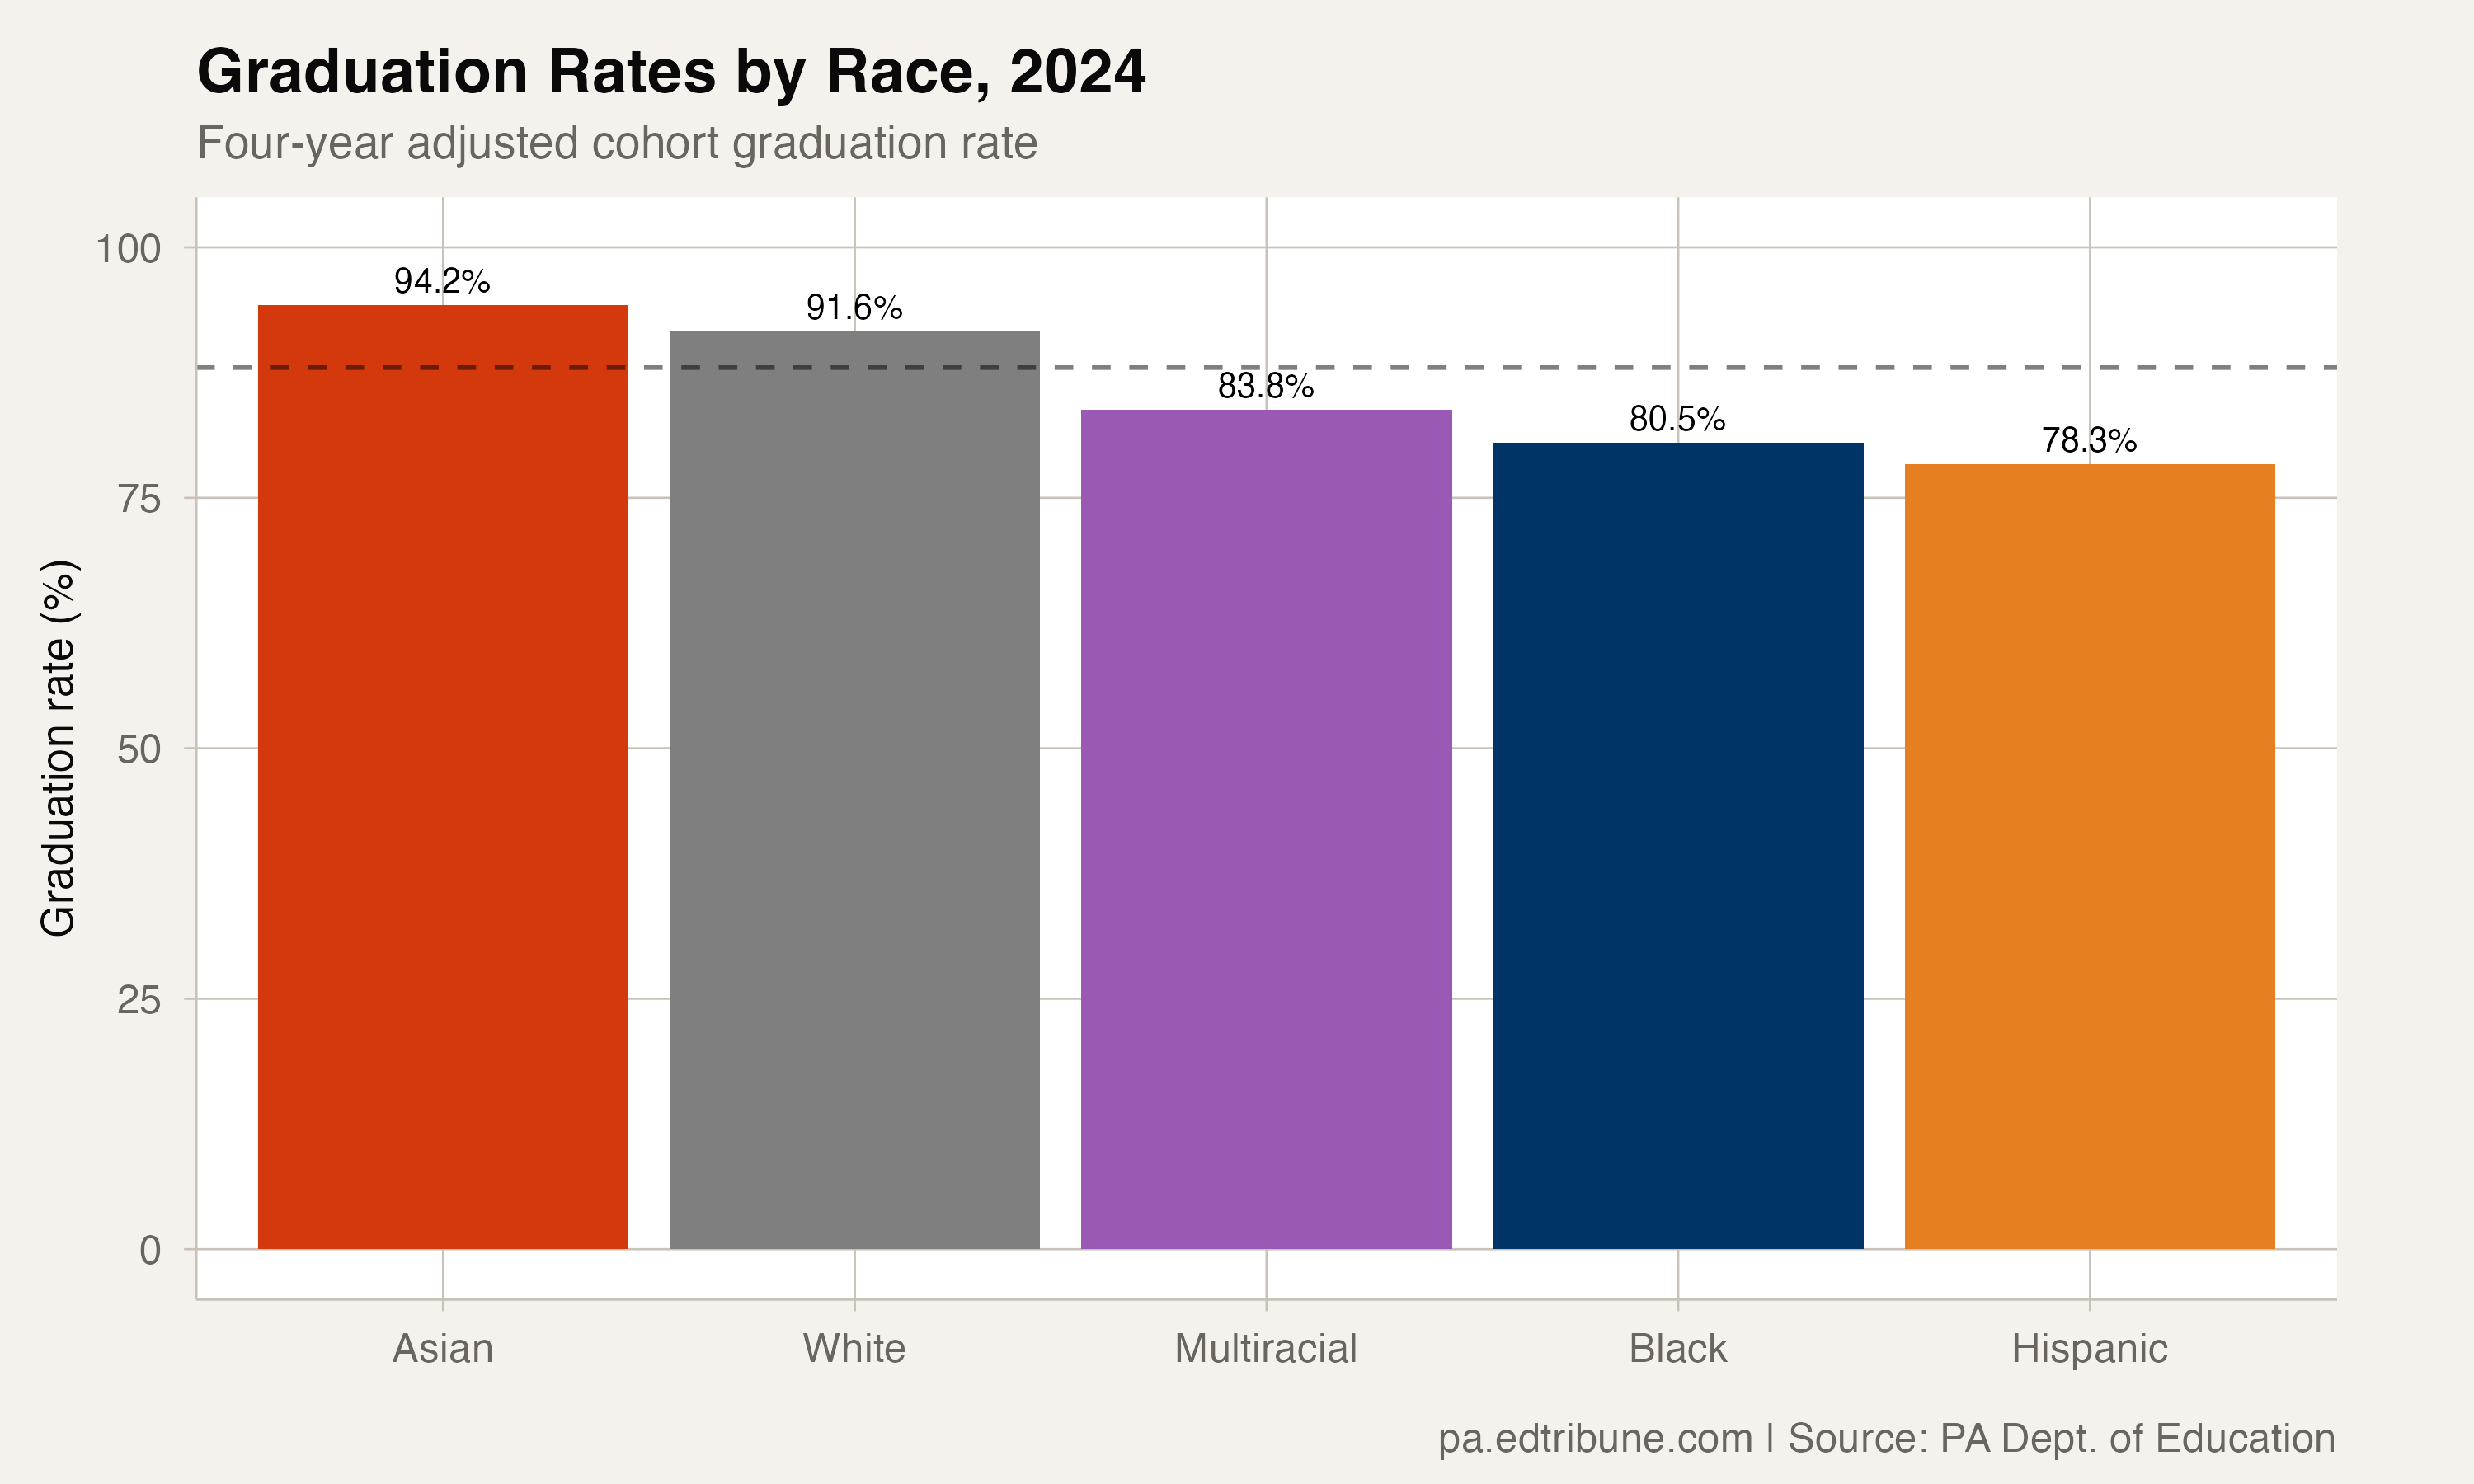
Even with the progress, 11.1 percentage points is not a small gap. It means that for every 100 Black ninth-graders entering high school, about 11 more will fail to graduate on time compared to their white peers.
Hispanic students face a similar disparity. Their graduation rate improved 13.8 percentage points to 78.3%, but the white-Hispanic gap remains 13.3 points, wider than the white-Black gap for the first time since 2018.
Asian students graduate at 94.2%, the highest rate of any subgroup. Multiracial students, for whom data is only available since 2017, graduated at 83.8%.
The graduation rate, for all its progress, measures only whether a student received a diploma in four years. It does not measure what they learned, whether they are prepared for college or careers, or whether the diploma reflects the same academic rigor across subgroups. Pennsylvania's Keystone Exam data, which shows persistent racial gaps in proficiency, suggests the graduation gap is closing faster than the underlying achievement gap.
The cohort question
There is a complicating factor in interpreting any graduation rate improvement: who is in the cohort being measured.
Pennsylvania's overall graduating cohort shrank 10.4% between 2011 and 2024. Philadelphia's Black cohort shrank even more dramatically, from 8,263 students in 2011 to an estimated fraction of the city's total 9,446 in 2024. Smaller cohorts can inflate graduation rates if the students who leave — to cyber charter schools, GED programs, or out-of-state moves — were disproportionately lower-performing.
Pennsylvania does not publish data that would allow researchers to track which students leave the cohort and why, making it impossible to fully separate genuine improvement from compositional change.
What is clear: the rate improvement is too large and too sustained to be explained solely by cohort attrition. A 15.2 point gain over 13 years, visible across districts of all sizes, reflects real changes in how schools serve Black students — even if the precise magnitude of the gain is somewhat overstated by a shrinking denominator.
What to watch
The white-Black gap has narrowed at an accelerating rate in the most recent three years. If the current pace holds, the gap would fall below 10 percentage points in the next available cohort. No large Northern state has reached that threshold.
Whether that happens depends on whether the policy levers credited with recent gains (9th grade early warning systems, lower counselor ratios, Act 158's alternative graduation pathways) continue to disproportionately benefit Black students. It also depends on whether the broader opportunity gaps that Chalkbeat and others have documented begin to narrow in parallel, or whether graduation rates simply diverge further from underlying academic preparation.
Detailed code that reproduces the analysis and figures in this article is available exclusively to EdTribune subscribers.
Discussion
Sign in to join the discussion.
Loading comments...