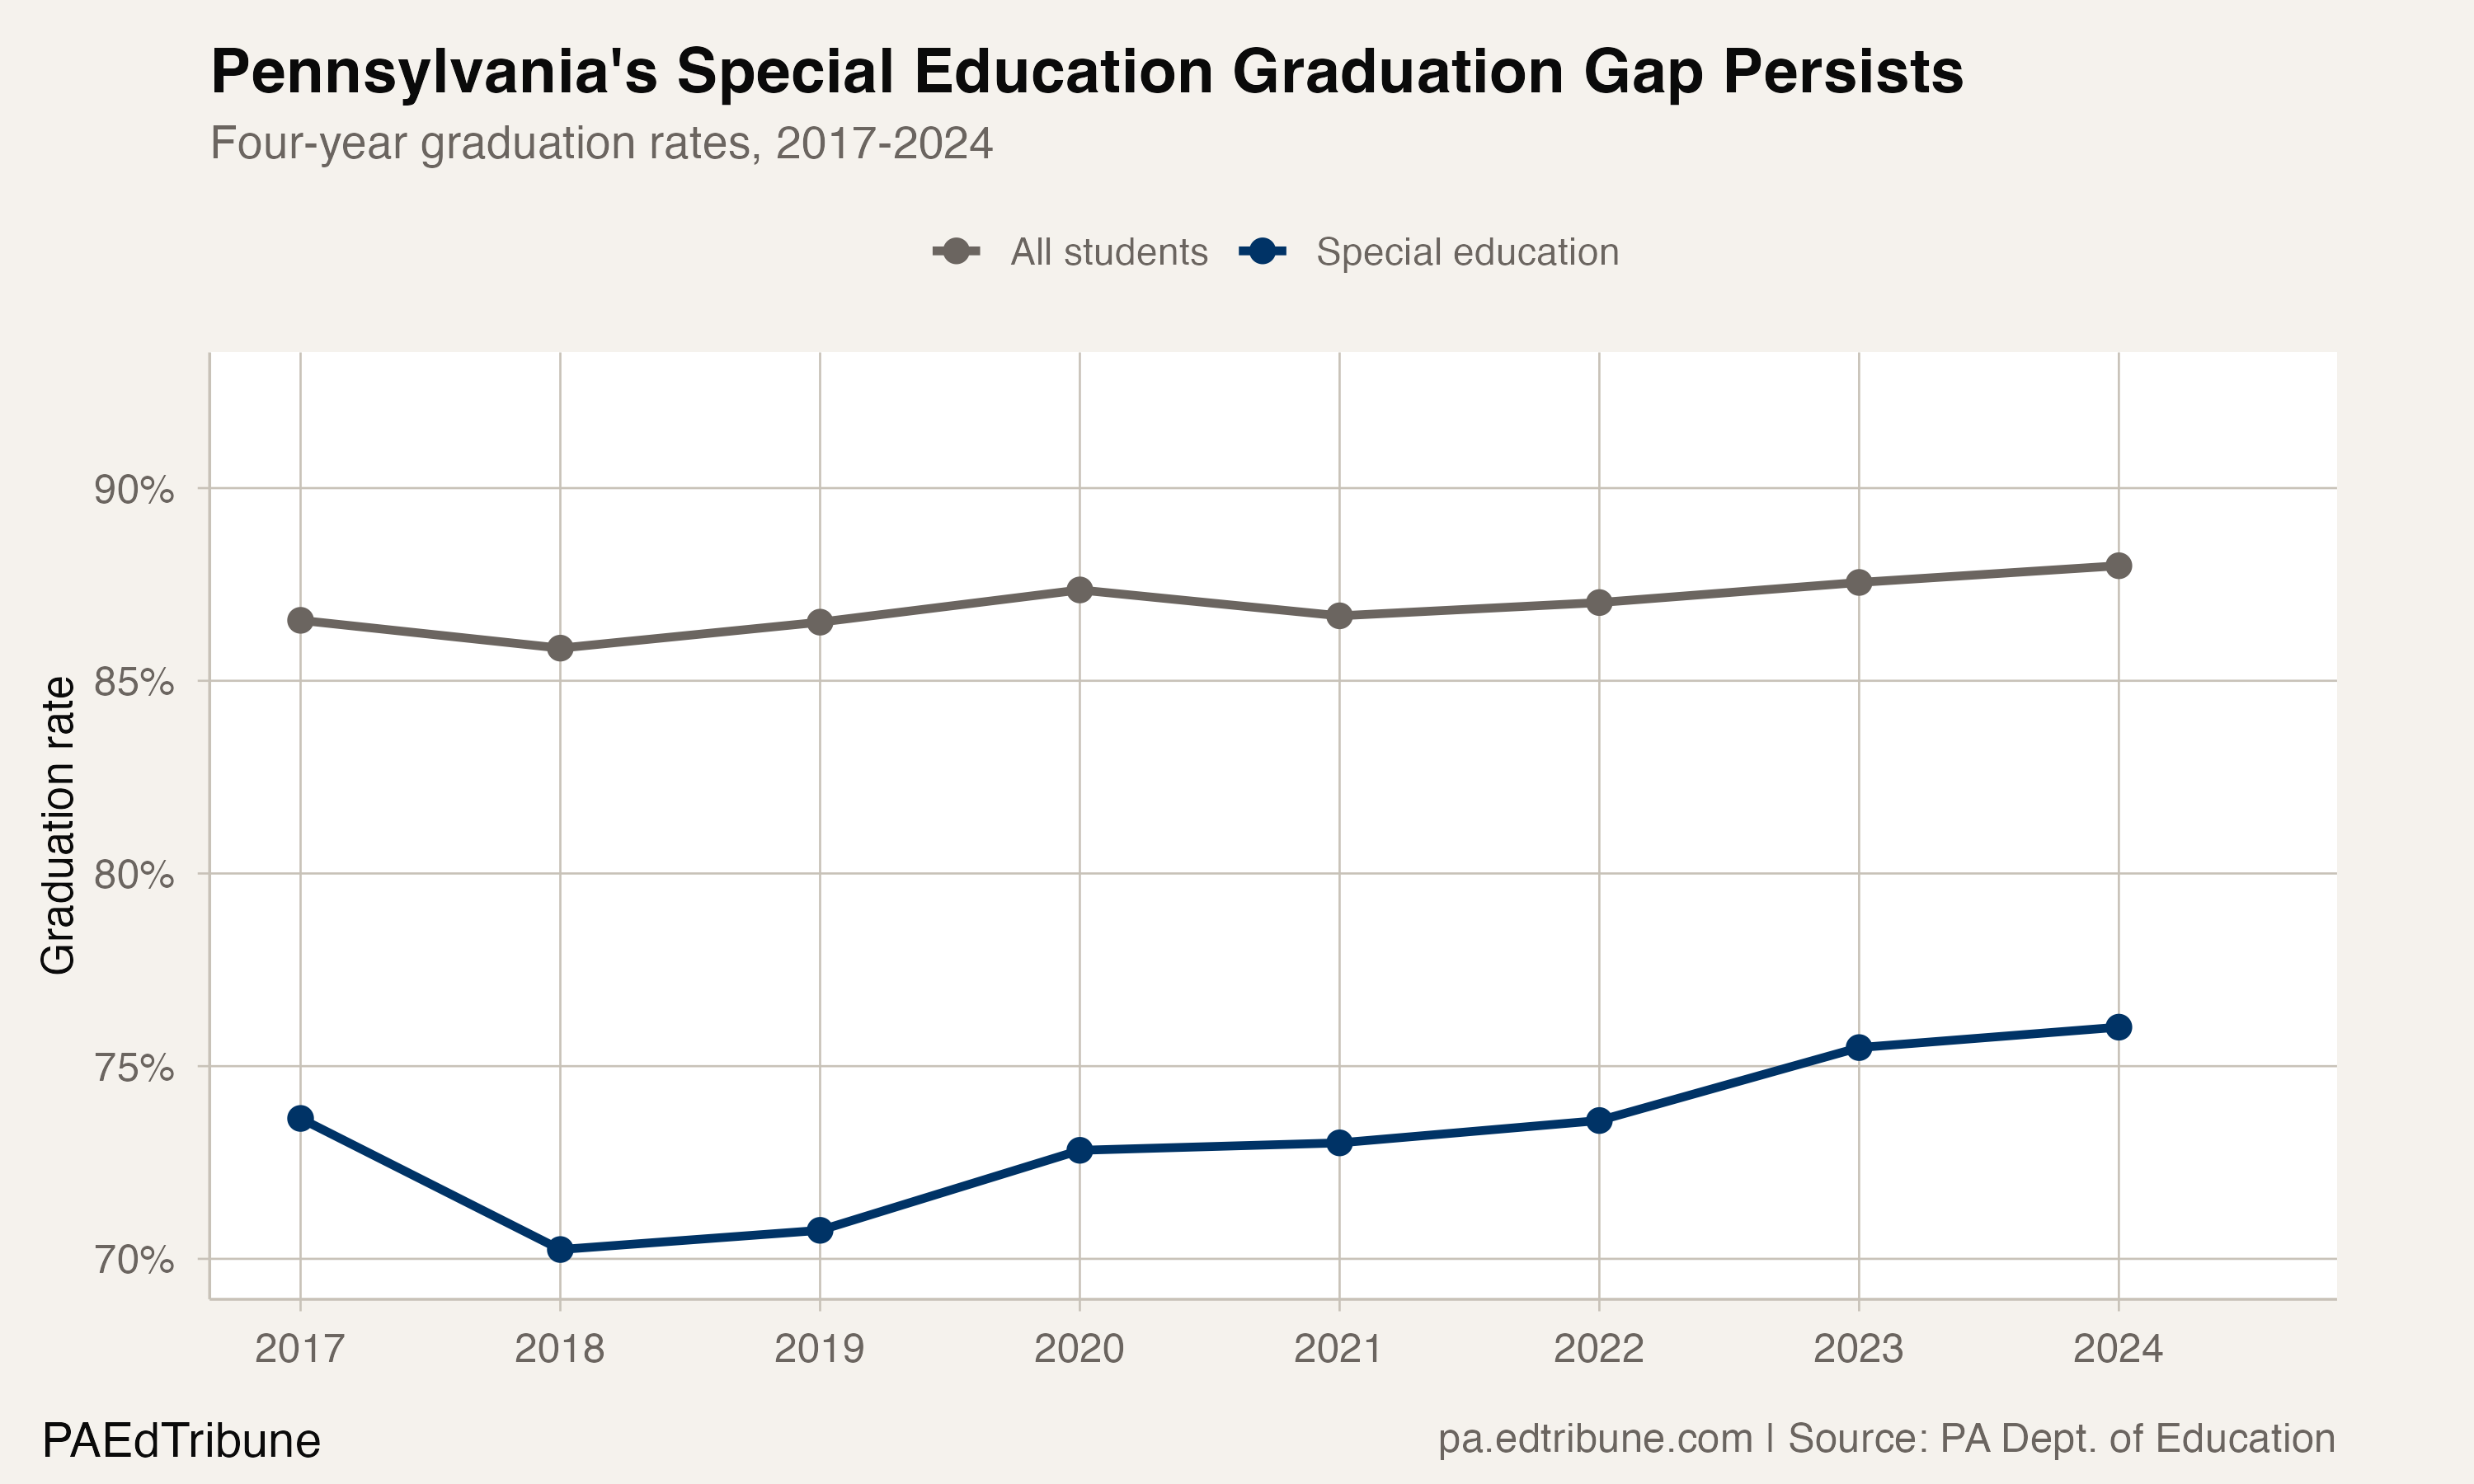
Pennsylvania's special education graduation rate reached 76.0% in 2024, up from 73.6% in 2017, the first year with a published statewide rate for the subgroup. Over the same period, the overall graduation rate rose from 86.6% to 88.0%.
The difference between those rates narrowed from 12.9 to 12.0 percentage points. That is a 0.95-point reduction across seven year-to-year intervals.
Put every gap on the same clock
The earlier version of this article compared the special education change since 2017 with changes in other gaps since 2011. That was not a like-for-like comparison.
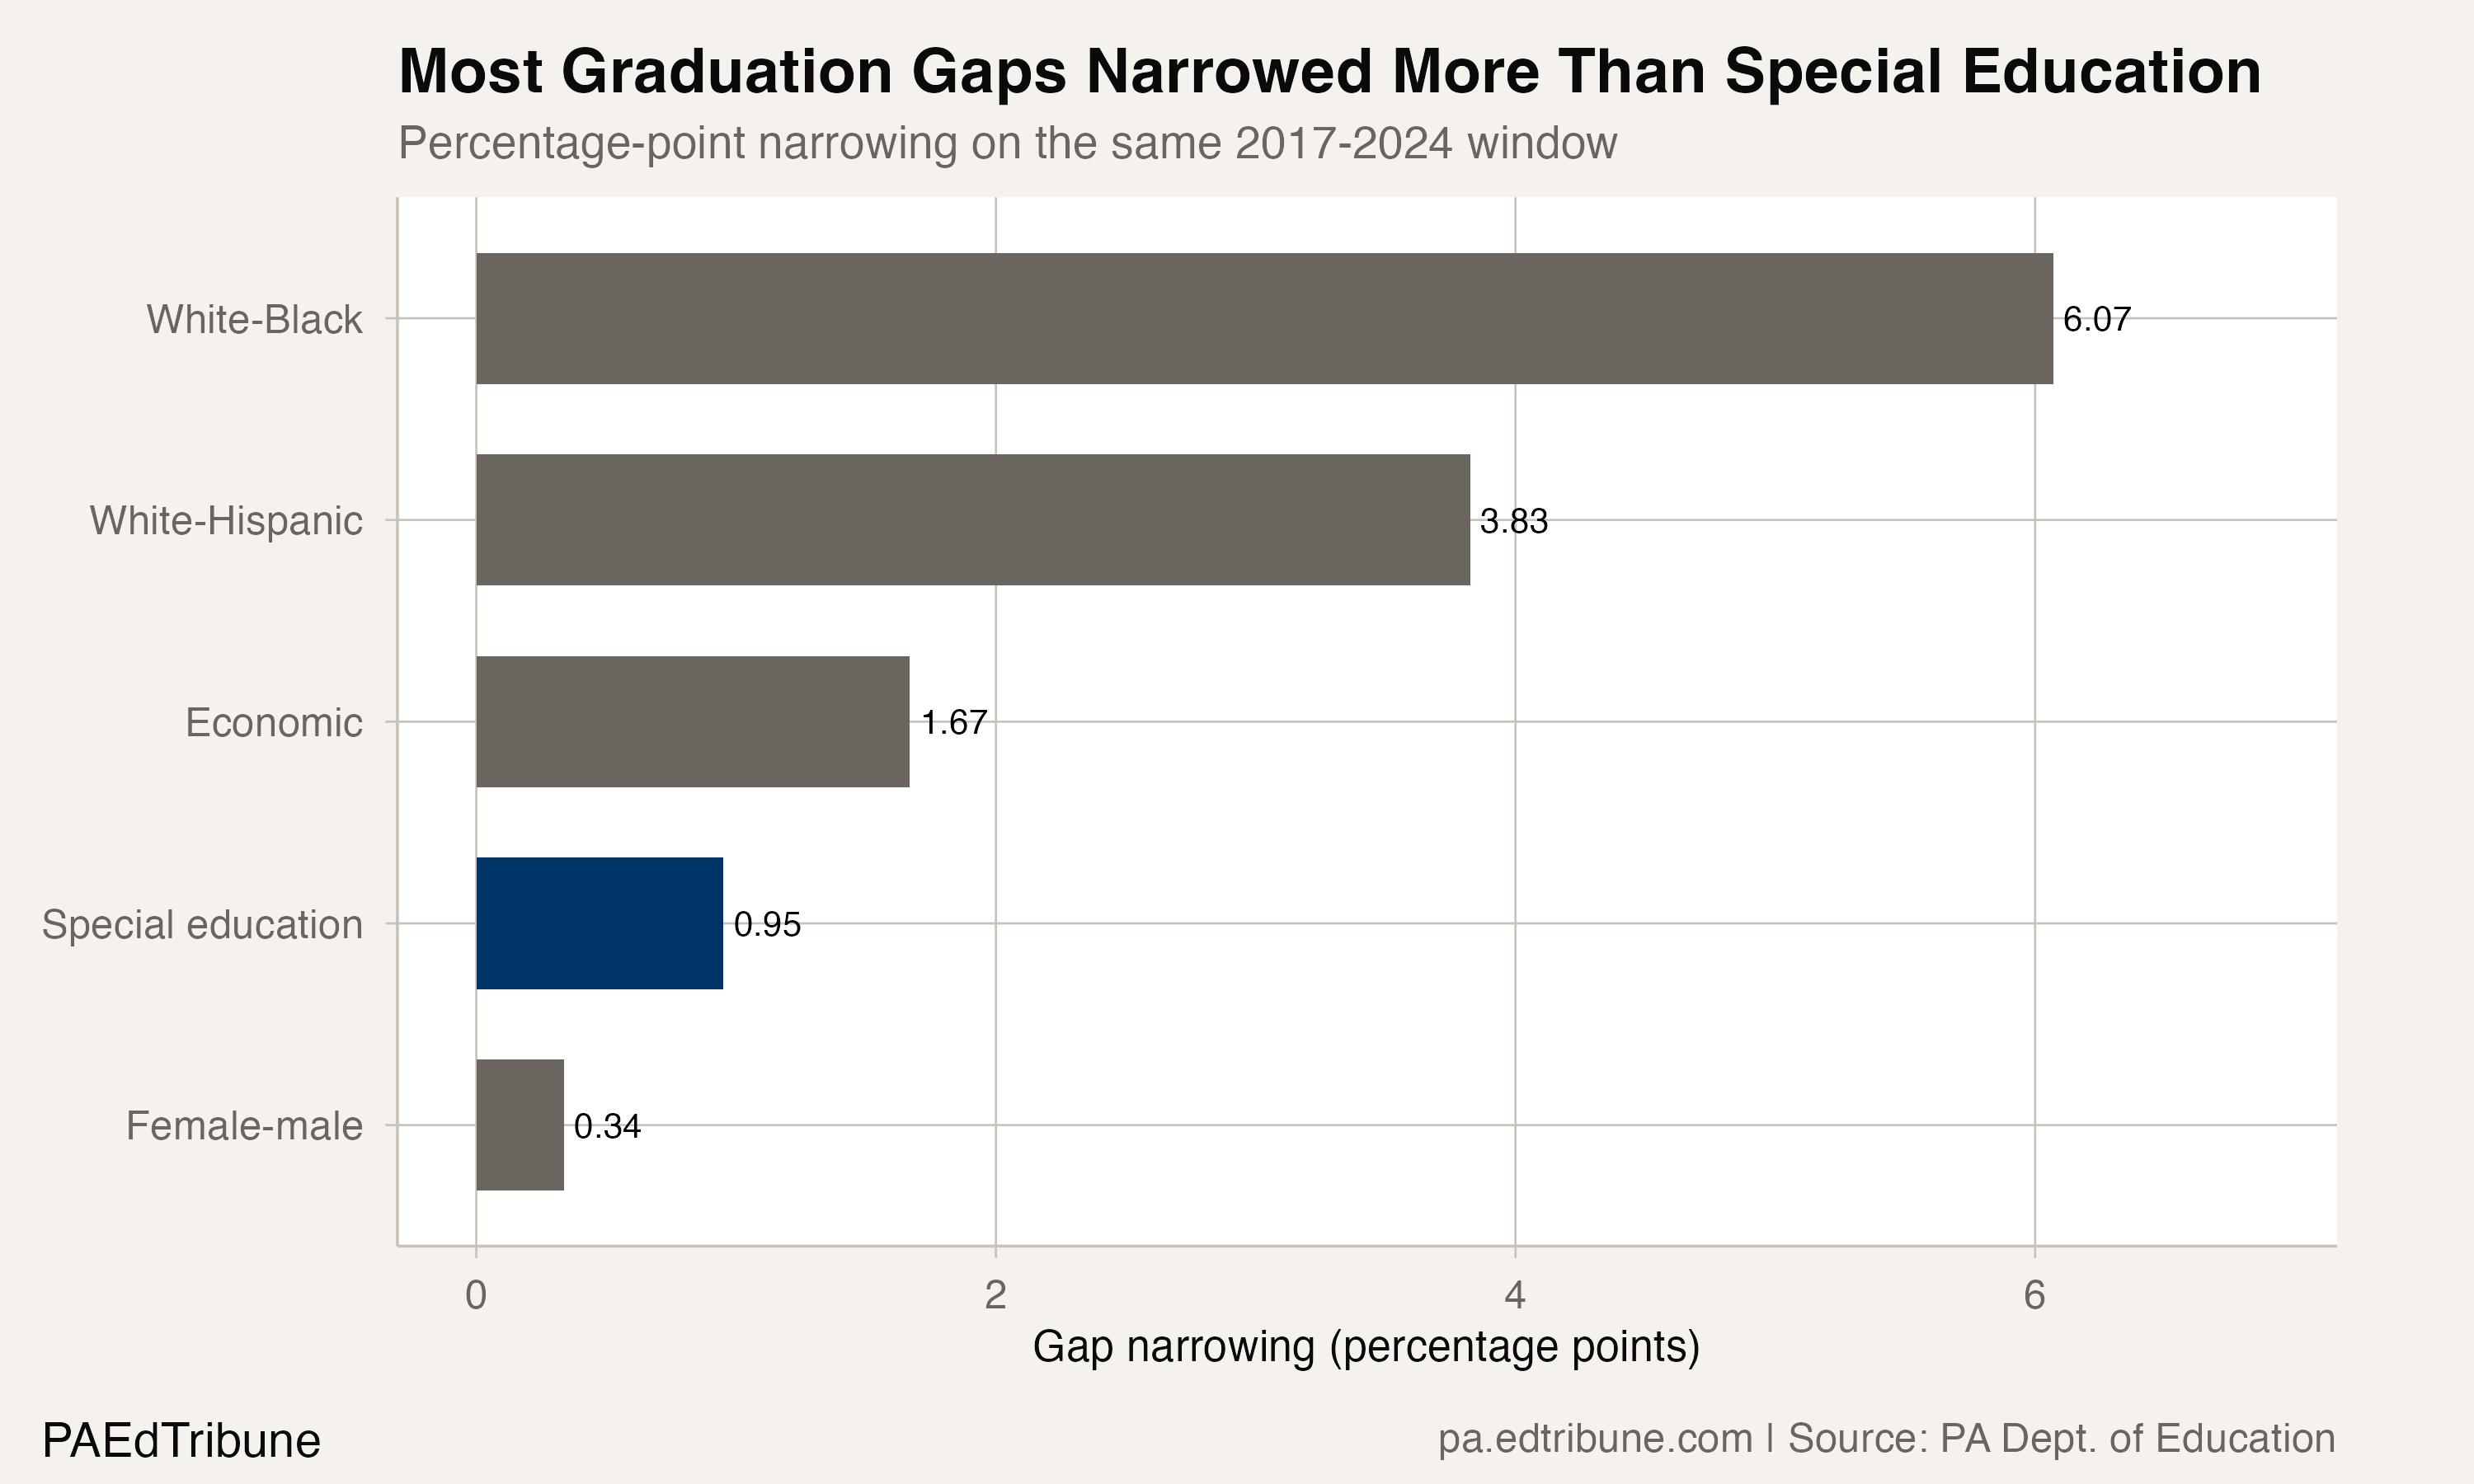
Using 2017 through 2024 for every measure, the white-Black graduation gap narrowed 6.07 points, the white-Hispanic gap narrowed 3.83 points and the gap between all students and economically disadvantaged students narrowed 1.67 points. The special education gap narrowed 0.95 point. The female-male gap narrowed less, by 0.34 point.
The special education gap widened after 2017 and peaked at 15.8 points in 2019. It then returned to 12.1 points in 2023 and 12.0 in 2024. Across the eight published annual observations, it ranged from 12.0 to 15.8 points.
The subgroup rate improved 2.37 points between 2017 and 2024, compared with a 1.42-point increase for all students. Special education students therefore improved 0.95 point faster, exactly matching the amount by which the gap narrowed.
What 76% means
A 76.0% four-year graduation rate means roughly one in four special education students in the cohort did not graduate within four years.
The 76.0% rate was below every published racial subgroup in 2024. Hispanic students had the lowest racial-group rate at 78.3%, followed by Black students at 80.5%. Economically disadvantaged students graduated at 82.9%.
What the data can establish
Pennsylvania's published statewide graduation file supports rate comparisons, but it does not publish a special education cohort count. That means the data can establish the 12.0-point rate gap, but not convert a hypothetical rate increase into a defensible number of additional special education graduates.
The measured conclusion is narrower: Pennsylvania's special education graduation rate improved, and it improved slightly faster than the overall rate. Seven years after the subgroup first appears in the statewide series, a 12-point difference remains.
Detailed code that reproduces the analysis and figures in this article is available exclusively to EdTribune subscribers.
Discussion
Sign in to join the discussion.
Loading comments...