Correction (July 28, 2026): An earlier version of this article treated an unnamed statewide rollup row in Pennsylvania's graduation file as though it were a school district. That row is the commonwealth-wide aggregate, not an individual district. Excluding it lowers the count of districts at an all-time high from 80 to 79 and the count of districts reporting a 2024 rate from 587 to 586, and moves the 2024 distance between the 90th-percentile and 10th-percentile districts from 15.7 to 15.8 percentage points. The earlier version also placed the median district rate more than four points above the district-level average; that distance is nearly two points, and it is the statewide rate the median sits more than four points above. A closing line that described the Pennsylvania Department of Education as having been asked for comment and having stayed silent has been removed. No such request was ever sent to the department, and the line should not have run. The analysis and the chart have been rebuilt from the corrected set of districts.
Seventy-nine school districts in Pennsylvania reached their highest-ever four-year graduation rate in 2024. Another 26 recorded their lowest rate of the available period, though most of those remain above 88 percent.
Taken together, the two counts describe a commonwealth where graduation is broadly improving. Records are being set across geography and district type, and the handful of districts posting personal lows are, with one notable exception, still graduating the large majority of their students.
The clustering at the top
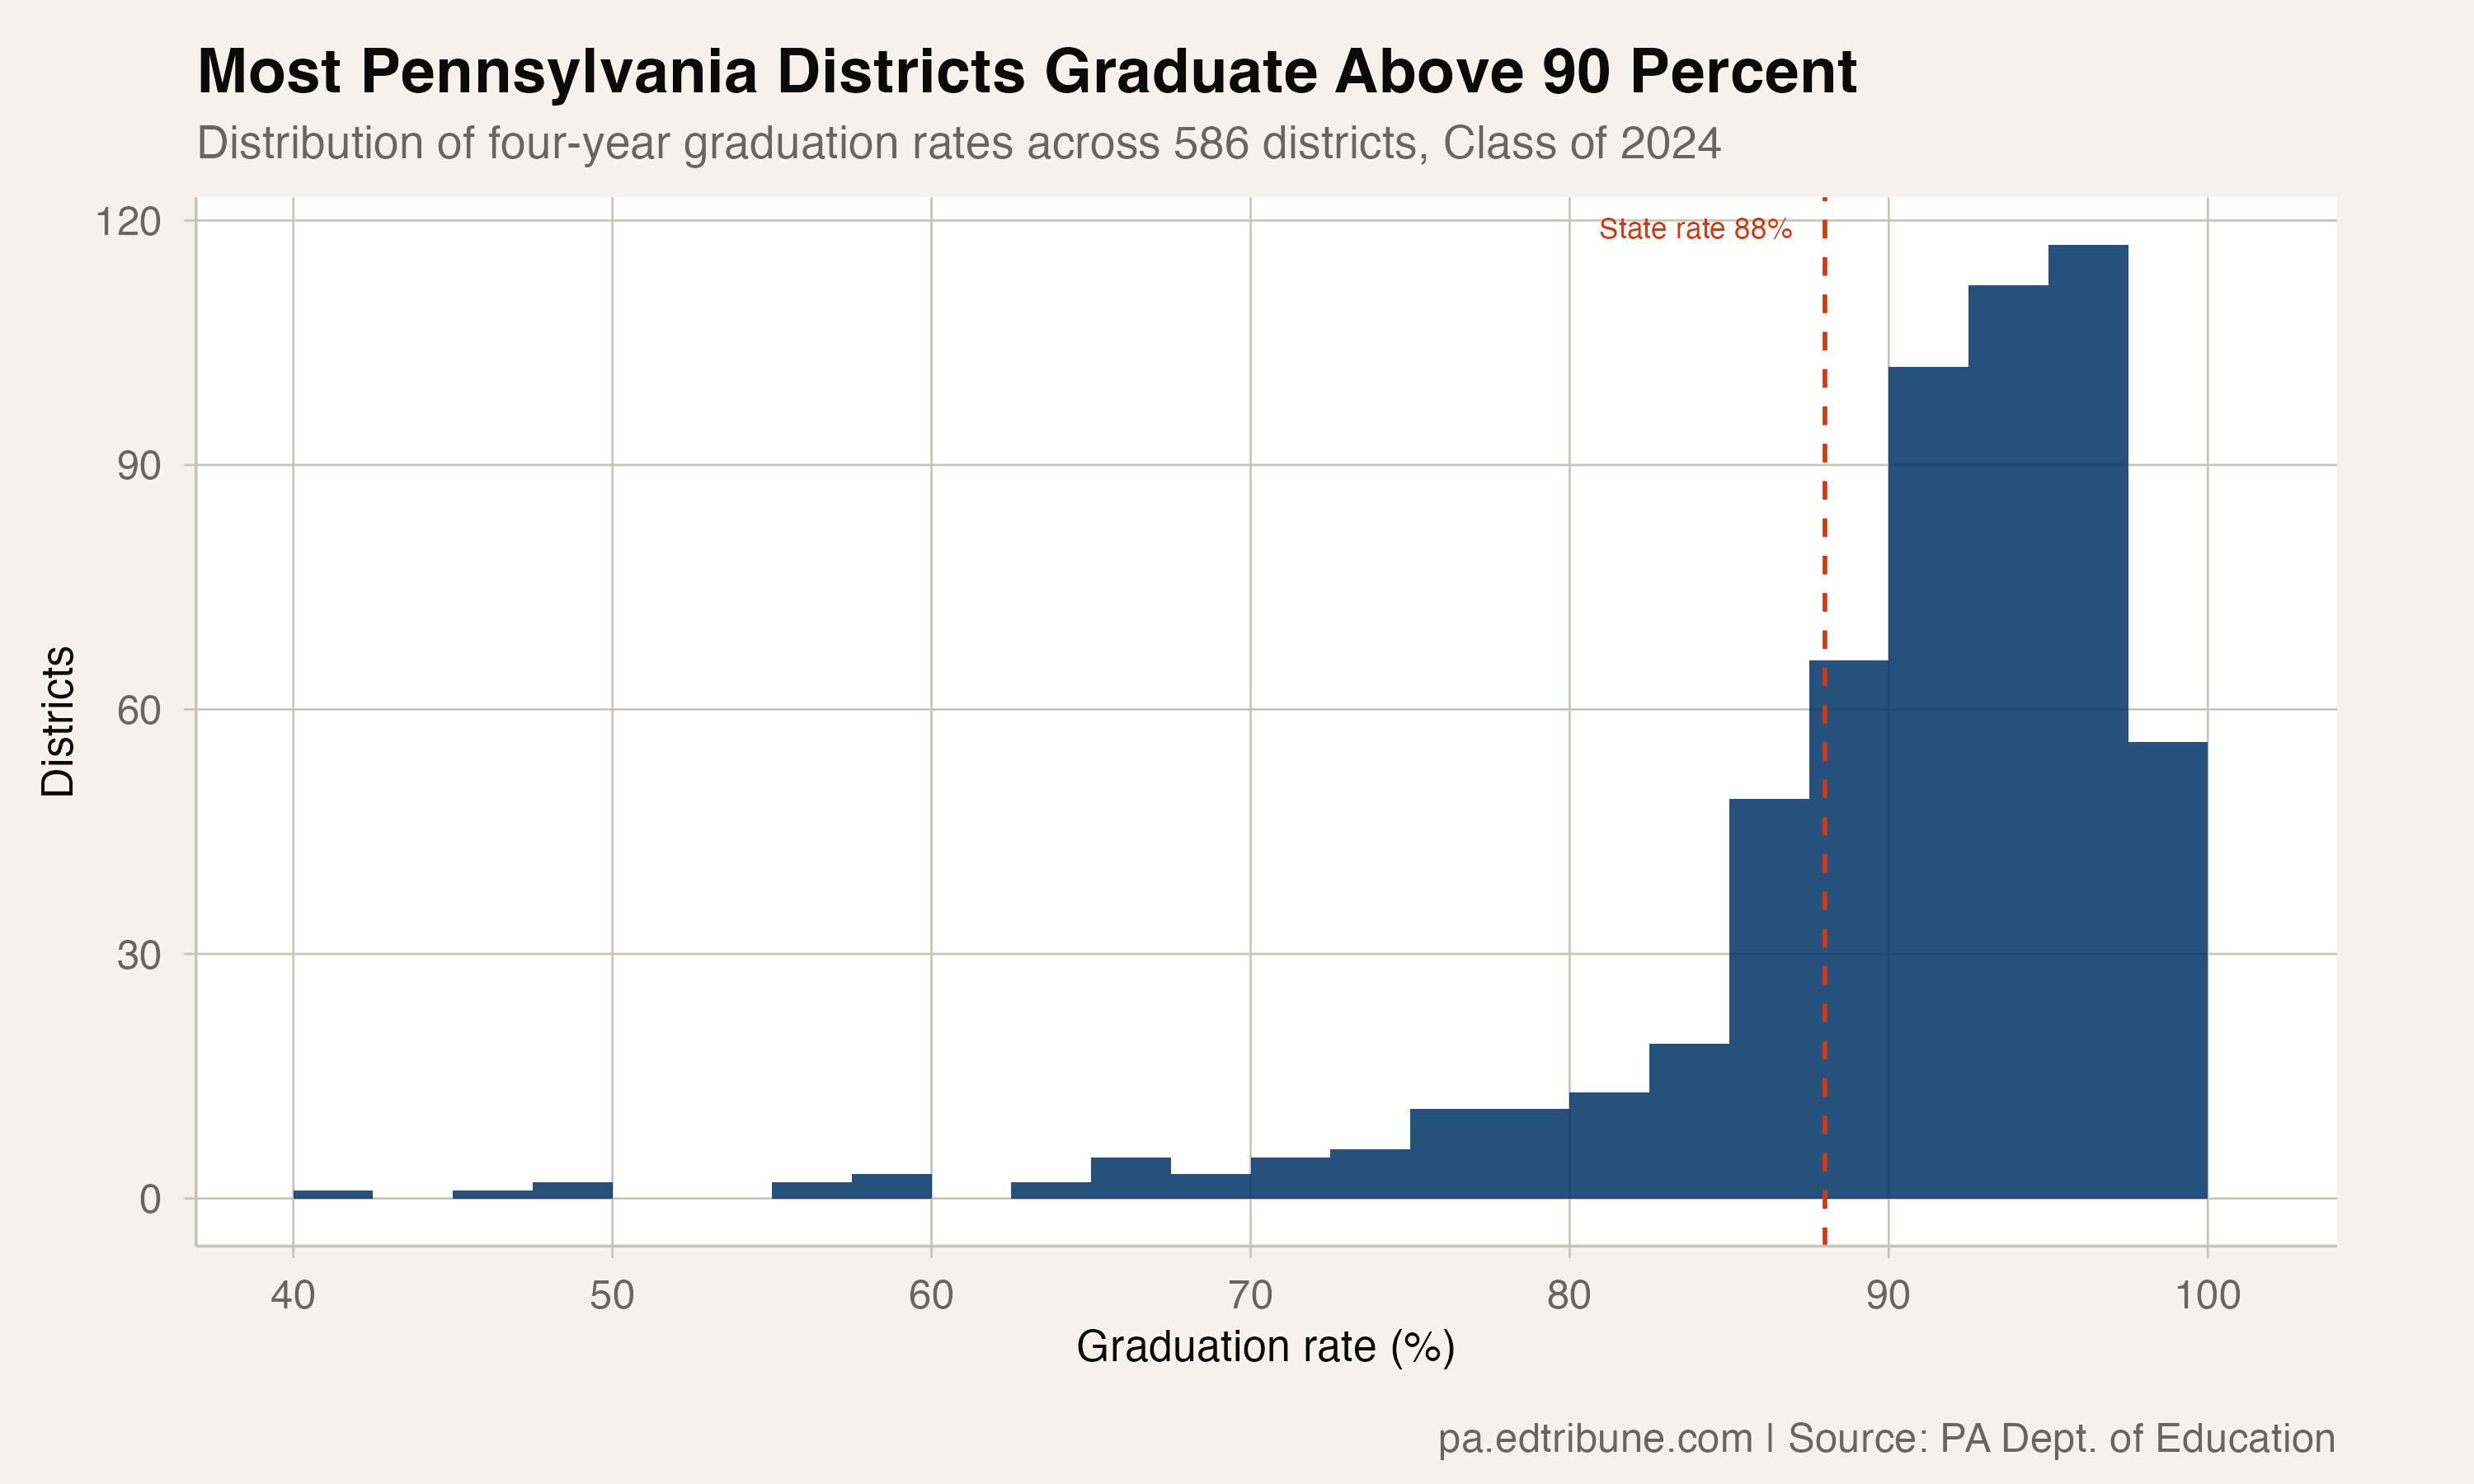
The distribution of graduation rates in 2024 sits high and to the right. Of 586 districts that reported a rate, 387 topped 90 percent and 173 topped 95 percent. Twelve districts reported a perfect 100 percent.
Because so many districts cluster near the top, the state's overall rate of 88.0 percent understates the typical district. The median district-level rate is 92.4 percent, more than four points above the statewide figure and nearly two points above the district-level average of 90.5 percent. That is the signature of a left-skewed distribution: most districts bunch high, and the average is dragged down by a small tail of low performers rather than by any broad weakness.
The 26 that recorded personal lows
Twenty-six districts posted their lowest rate of the period in 2024, but the label covers very different situations. Most are strong districts that slipped modestly against their own history. Great Valley (93.2 percent), Dallastown Area (91.6 percent), and Pennridge (90.1 percent) each set a personal low while still graduating more than nine in ten students.
The exception is Erie City SD↗ET, which graduated 70.2 percent of a cohort of about 735 students. That is the lowest rate among all districts reaching a record low, and Erie is the only large district whose personal low is also a genuinely low absolute rate. The rest of the bottom of the distribution is a scatter of small districts, where a few additional non-graduates can swing the rate several points, alongside a handful of charter schools.
What broad improvement looks like
The 79 districts at all-time highs span the state geographically and demographically. They include suburban districts in the Philadelphia and Pittsburgh metropolitan areas that have climbed for years, rural districts in central and northern Pennsylvania, and several small districts.
The breadth suggests that whatever is lifting graduation rates in Pennsylvania, whether Act 158's alternative pathways, accountability pressure, improved early-warning systems, or demographic effects from shrinking cohorts, is operating across contexts. This is not a story of a few star districts pulling up the average.
The gap between top and bottom
The distance between the 90th-percentile district and the 10th-percentile district was 15.8 percentage points in 2024, down from 19.3 points in 2011. The whole distribution has shifted toward higher rates, and the spread between leaders and laggards has slowly compressed rather than held fixed, easing from roughly 19 points early in the decade to below 16 by 2024.
That narrowing is modest, not dramatic, and it does not erase the gap. A statewide rate of 88.0 percent that still contains districts near 70 percent alongside districts at 100 percent describes real and persistent variation. But the direction of travel over the period is toward a somewhat tighter distribution, not a widening one.
Detailed code that reproduces the analysis and figures in this article is available exclusively to EdTribune subscribers.
Discussion
Sign in to join the discussion.
Loading comments...